

Precise Color Communication
 |
|
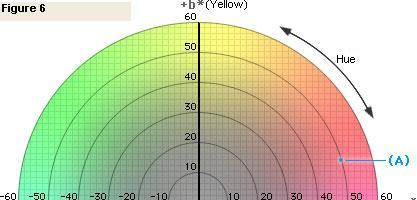
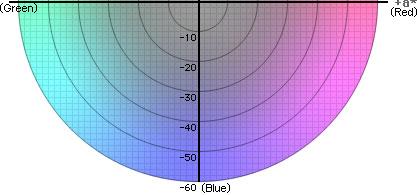
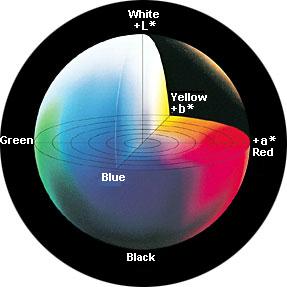
The L*a*b* color space (also referred to as CIELAB) is presently one of the most popular spaces for measuring object color and is widely used in virtually all fields. It is one of the uniform color spaces defined by CIE in 1976 in order to reduce one of the major problems of the original Yxy space: that equal distances on the x, y chromaticity diagram did not correspond to equal perceived color differences. In this space, L* indicates lightness and a* and b* are the chromaticity coordinates. Figure 6 shows the a*, b* chromaticity diagram. In this diagram, the a* and b* indicate color directions: +a* is the red direction, -a* is the green direction, +b* is the yellow direction, and -b* is the blue direction. The center is achromatic; as the a* and b* values increase and the point moves out from the center, the saturation of the color increases. Figure 8 is a representation of the color solid for the L*a*b* space; Figure 6 is a view of this solid cut horizontally at a constant L* value. 
|
  |
|
To see what color these values represent, let's first plot the a* and b* values (a*=+47.63, b*=+14.12) on the a*, b* diagram in Figure 8 to obtain point (A), which shows the chromaticity of the apple. Now, if we cut the color solid of Figure 8 vertically through point (A) and the center, we obtain a view of chromaticity versus lightness, part of which is shown in Figure 7. 
|
 |
| 7/13 | ||
|
|