KONICA MINOLTA

Measuring Instruments

Giving Shape to Ideas

Precise Color Communication


We discussed the colors of the spectrum (red, orange, yellow, green, ...) in Part II-2. 
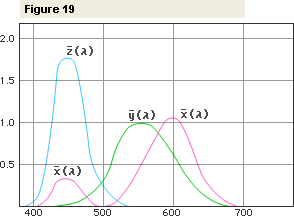
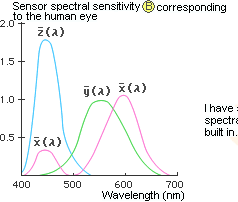
Of these colors, red, green, and blue are generally considered the three primary colors of light. 
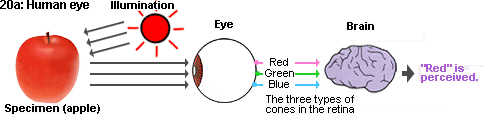
This is because the eye has three types of cones (color sensors) which are sensitive to these three primary colors and which allow us to perceive color. Figure 19 shows the spectral sensitivity curves corresponding to the human eye, according to the CIE definition of the 1931 Standard Observer. These are referred to as the color matching functions. has a high sensitivity in the red wavelength region, has a high sensitivity in the green wavelength region, and has a high sensitivity in the blue wavelength region. The colors that we see are the result of different , , and proportions (stimuli) in the light received from an object.


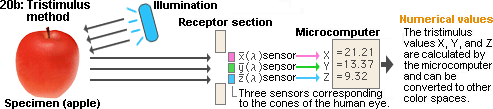
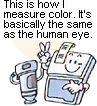
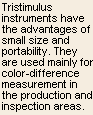
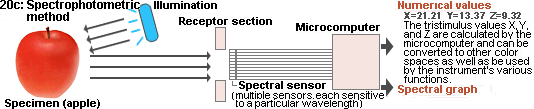
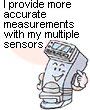
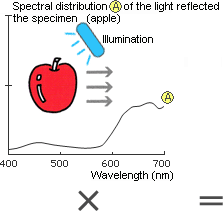
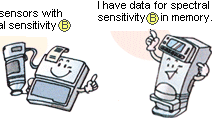
As shown in Figure 20b, the tristimulus method measures the light reflected from the object using three sensors filtered to have the same sensitivity , , and as the human eye and thus directly measures the tristimulus values X, Y, and Z. On the other hand, the spectrophotometric method shown in Figure 20c utilizes multiple sensors (40 in the CM-2002) to measure the spectral reflectance of the object at each wavelength or in each narrow wavelength range. The instrument's microcomputer then calculates the tristimulus values from the spectral reflectance data by performing integration. For the apple used in the example, the tristimulus values are X=21.21, Y=13.37, and Z=9.32; these tristimulus values can then be used to calculate values in other color spaces such as Yxy or L*a*b*.


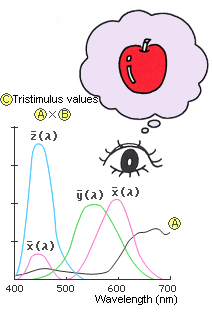
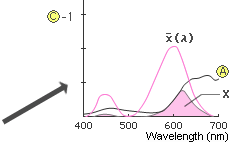
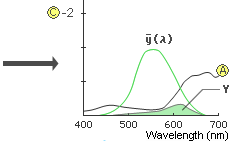
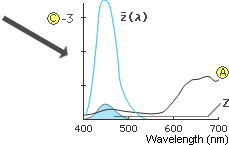
Figure 21 shows how the tristimulus values X, Y, and Z are determined. Light with spectral distribution reflected by the specimen is incident on sensors with spectral sensitivity , whose filters divide the light into wavelength regions corresponding to the three primary colors and the sensors output the tristimulus values (X, Y, and Z) . Thus, = ~ . The results in the three wavelength regions of are also shown: -1: , -2: , and -3: . The tristimulus values are equal to the integrations of the shaded area in the three graphs.


6/9

Back to top