

Precise Color Communication
 |
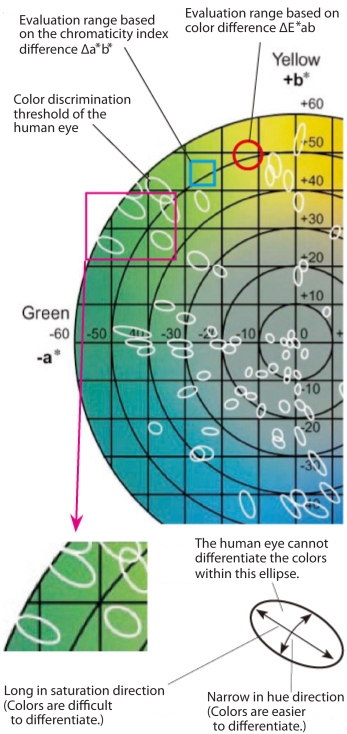
The human eye cannot differentiate some colors from others even if they are different. The area of such colors on the chromaticity diagram is called the color discrimination threshold of the human eye. |
|
|
The figure on the right is part of the a*b* chromaticity diagram representing the CIE Lab color space. The white ellipses on the diagram represent the color discrimination thresholds of the human eye concerning saturation and hue. In other words, the human eye cannot differentiate the colors within the same ellipse. A close look at these white ellipses shows the following four characteristics of the color differentiation ability of the human eye on the chromaticity diagram of CIE Lab (L*a*b* color space). 1) The sensitivity to color differences is low for the colors with high saturation. Consequently, such colors are difficult to differentiate. (Saturation dependency is high.) The shape of the ellipses becomes close to a circle for colors with low saturation, and it becomes longer in the direction of saturation and narrower in the direction of hue for colors with high saturation. This means that the human eye cannot differentiate colors with high saturation although their color difference is relatively great. |
 |
2) The sensitivity to the color differences in the direction of hue varies depending on the hue. Look at white ellipses A and B in the diagram. A is located around the hue angle of 120 degrees (yellowish green), and B is located around the hue angle of 180 degrees (green). Although their saturation is similar, A is wider in the direction of hue, and B is narrower. This means that the sensitivity to the color differences regarding hue is higher in B than in A.
3) The sensitivity to the color difference in the direction of lightness varies depending on the lightness. Unfortunately, the lightness cannot be seen in the figure because it is represented by a normal line perpendicular to the diagram. It is said that the sensitivity becomes highest around the lightness of 50, and decreases for both higher and lower lightness. |
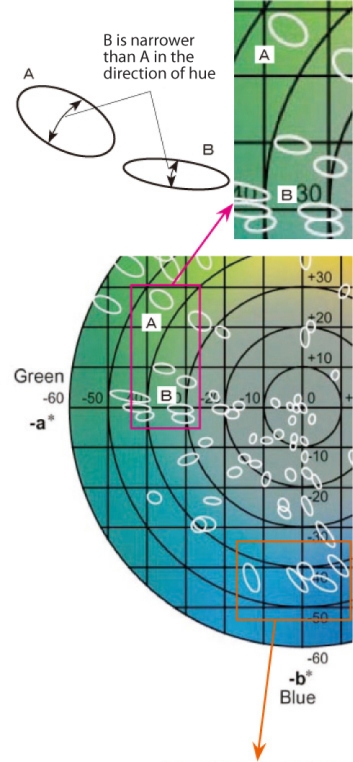 |
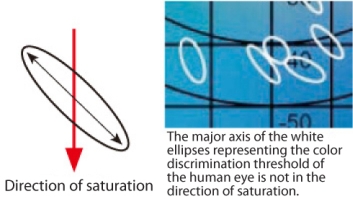
4) For blue colors, the direction of the color discrimination threshold changes. The figure shows that the major axes of the white ellipses for blue colors do not match with the direction of saturation spreading from the center. |
 |
|
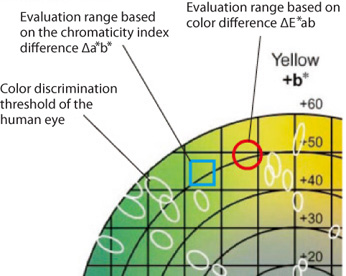
It is this mismatch that causes differences in the color difference evaluation between color meters and the human eye. The color difference ΔE*ab generally used for the color difference evaluation with CIE Lab (L*a*b* color space) is represented by a perfect circle for every saturation and hue as shown by the red circle in the figure on the right. The chromaticity index difference Δa*b*, another commonly-used evaluation method, is represented with a square as shown by the blue square in the figure. Both shapes differ considerably from the shape of the color discrimination threshold of the human eye (white ellipse). The differences in these shapes manifest themselves as the differences between the calculation result by color meters and the evaluation by the human eye. |
 |
Note: The figures showing white ellipses representing the color discrimination thresholds of the human eye used here are based on Figure 1 excerpted from the paper titled "The Development of the CIE 2000 Colour-Difference Formula: CIEDE2000" written by M.R. Luo, G. Cui, and B. Rigg, which appeared in COLOR Research and Application, No. 5 (Volume 26), page 341 published in October, 2001, with the cooperation and approval of the journal and authors.
Figure 1 on page 341 of the journal is copyrighted by John Wiley & Sons, Inc. |
|
| 2/3 | ||
|
|