Search within the site
Operating Data
- New Segment
- Previous Segment
■1Q ■2Q(total) ■3Q(total) ■Full Year ●Full Year(%)
Digital Workplace Business Consolidated
Revenue & Operating Profit Ratio
Professional Print Business Consolidated Revenue &
Operating Profit Ratio
Industry Business Consolidated Revenue & Operating Profit Ratio
Imaging Solutions Business Consolidated Revenue & Operating Profit Ratio
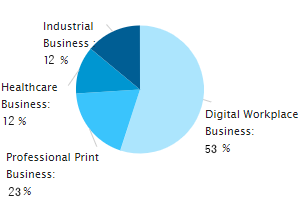
Latest Term Business Composition

Reportable segments were classified into three segments, namely “Digital Workplace Business,” “Professional Print Business,” “Healthcare Business,” and “Industry Business.” A change to this business segmentation has been made and starting from the first quarter of fiscal year ending 2025, segment information is presented for the four segments of “Digital Workplace Business,” “Professional Print Business,” “Industry Business,” and “Imaging Solutions Business.”
The Precision Medicine Business is classified as a discontinued operation from the nine months ended December 31, 2024. As a result, revenue, business contribution profit, operating profit, and profit before tax represent the amount of continuing operations excluding the discontinued operation. Profit for the period and profit attributable to owners of the Company represent the sum of continuing operations and the discontinued operation. In addition, the results for the fiscal year ended March 2024 include discontinued operations.
Overview by Segment
i. Digital Workplace Business
ii. Professional Print Business
iii. Industry Business
iv. Imaging Solutions Business
■1Q ■2Q(total) ■3Q(total) ■Full Year ●Full Year(%)
Digital Workplace Business Consolidated
Revenue & Operating Profit Ratio
Professional Print Business Consolidated Revenue &
Operating Profit Ratio
Healthcare Business Consolidated Revenue & Operating Profit Ratio
Industry Business Consolidated Revenue & Operating Profit Ratio
Latest Term Business Composition
Reportable segments were classified into three segments, namely “Office Business,” “Professional Print Business,” “Healthcare Business,” and “Industrial Business.” A change to this business segmentation has been made and starting from the first quarter of fiscal year ending 2020, segment information is presented for the four segments of “Digital Workplace Business,” “Professional Print Business,” “Healthcare Business,” and “Industry Business.”
IR Newsletter

※Clicking the link above will take you to the“Mitsubishi UFJ Trust and Banking Corporation”website.
Most Viewed
- Financial Results / Presentation Materials FY2025
- IR Materials
- Medium-term Business Plan
- IR Events
- Integrated Report (Annual Report)
Period : 01/05/2026 to 31/05/2026


About Konica Minolta