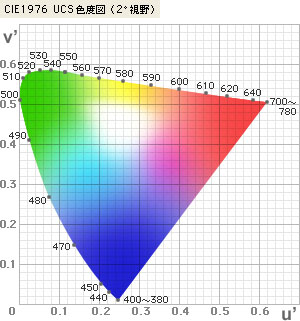
The CIE 1976 UCS Diagram was defined by the CIE in 1976.
It is intended to provide a perceptually more uniform color spacing for colors at approximately the same luminance.
The values of u' and v' can be calculated from the tristimulus values XYZ (or
) or from the chromaticity coordinates xy according to the following formulas:
where
X, Y, Z:
Tristimulus values (If tristimulus values
are used, the results will be u'10 and v'10.)
x, y:
Chromaticity coordinates (If chromaticity coordinates
x10
y10
are used, the results will be u'10
and v'10.)
This color difference formula modifies the lightness, saturation, and
hue (L*C*h) of the L*a*b* color space
by incorporating factors that correct for variation in perceived color difference magnitude in different areas of
the CIE 1976 L*a*b* color space.
This was proposed in 1994 by the technical committee of CIE.