Environmental Data
CO2 Emissions Across the Entire Supply Chain
CO2 Emissions Across the Entire Supply Chain
Konica Minolta has calculated the CO2 emissions associated with the Group’s activities across its entire supply chain, from the upstream to the downstream aspects of its operations, based generally on the standards of the GHG Protocol*, the international standard. In fiscal 2024, the calculation showed that CO2 emissions throughout the supply chain were approximately 1,107 thousand tons, which represents an increase of approximately 5% from fiscal 2023. Emissions from the Group’s activities including direct emissions from fuel use (Scope 1) plus indirect emissions from the consumption of purchased electricity, heat or steam (Scope 2) totaled approximately 271 thousand tons, or approximately 24% of all emissions. In contrast, indirect emissions associated with Konica Minolta’s activities (Scope 3) amounted to approximately 836 thousand tons, accounting for around 76% of the total. The Company identified previously uncalculated emissions in the “purchased goods and services” category, which constitutes the largest portion of Scope 3 emissions across the entire supply chain. Since calculation for this category is expected to continue, these emissions have been newly included in the FY2024 results. For “use of sold products,” which has the next highest emissions, the Company is working on power consumption of the products themselves and developing features that encourage customers to save energy, in addition to reducing the power consumption of the products themselves. Konica Minolta will share information with relevant stakeholders in the future based on the results of these calculations and move forward with CO2 emissions management and reduction activities throughout the supply chain.
- *
- GHG Protocol: International standard for calculating and reporting greenhouse gas (GHG) emissions
CO2 Emissions Across the Entire Supply Chain (FY2024)
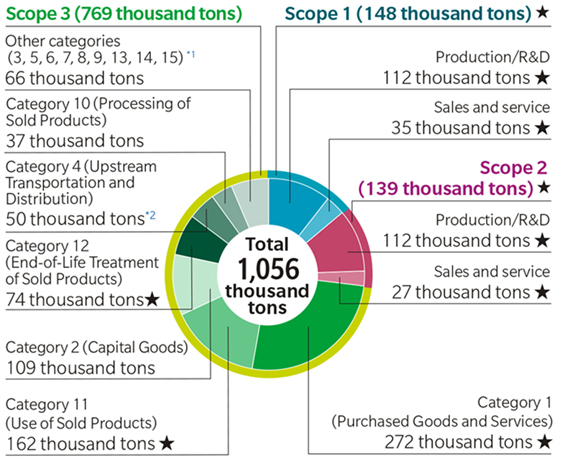
- *1
- Categories3(Fuel-and Energy-Related Activities), 5(Waste Generated in Operations), 6(Business Travel), 7(Employee Commuting), 8(Upstream Leased Assets), 9(Downstream Transportation and Distribution), 13(Downstream Leased Assets), 14(Franchises) and 15(Investments)
- *2
- CO2 emissions attributed to product distribution: 53 thousand tons
Note:Figures do not necessarily add precisely to the total due rounding.
See Environmental Data (Excel) in ESG Data for more information
Method of Calculation in Each Category of Scope 3 Emissions
| Category | Overview | Method of Calculation |
|---|---|---|
| 1 | Purchased goods and services | Calculated by multiplying the sales amount or production amount of office equipment and consumables by a cradle-to-gate CO2 emission factor for each of the materials that make up a product; and for other products, multiplying the amount of material used by a cradle-to-gate CO2 emission factor for that material. |
| 2 | Capital goods | Calculated by multiplying the amount of investment in capital goods purchased over the year by a CO2 emission factor per investment value. |
| 3 | Fuel- and energy-related activities | Calculated for emissions from the extraction, production, and transportation of fuels purchased by the Group or by electricity producers for the electricity purchased by the Group. (Fuel) Calculated by multiplying the annual purchased volume by a cradle-to-gate CO2 emission factor for each type of fuel. (Electricity) Calculated by multiplying the amount of electricity purchased by source, by the CO2 emission factor related to fuel procurement for that source. The energy mix for each country is identified from the Proportions of Generated Power by Source in Major Countries, published by the Federation of Electric Power Companies of Japan. |
| 4 | Upstream transportation and distribution | Emissions in this category are the sum of: A) emissions related to transportation of parts and raw materials the Group purchases, and B) emissions related to transportation of the Group's products. A) Calculated for emissions related to procurement distribution from suppliers to Konica Minolta's plants. Calculated by multiplying transport distance by cargo weight, and then multiplying that value by the CO2 emission factor for each means of transportation. B) Calculated for emissions related to shipping and distribution internationally, within Japan, and within China and Malaysia. Calculated by multiplying transport distance by cargo weight, and then multiplying that value by the CO2 emission factor for each means of transportation. |
| 5 | Waste generated in operations | Calculated for waste (not including valuables) from production, R&D, and sales offices. Calculated by classifying waste into different types and multiplying the amount of each type of waste entrusted to a party outside the company by a CO2 emission factor for each method of waste disposal. |
| 6 | Business travel | For business travel by employees of Group companies in Japan, the emissions are calculated by multiplying the annual business travel expenditure by a CO2 emission factor per expense for travel for each means of transportation. The CO2 emission factor used is that for travel by domestic air flight in Japan, which is the highest among the emission factors for all methods of travel. For Group companies outside Japan, it is estimated by multiplying the number of employees of each company by the emission amount per employee calculated based on the result in Japan. |
| 7 | Employee commuting | Calculated by multiplying the annual commutation cost by a CO2 emission factor per expense. The CO2 emission factor used is for “automobiles (buses and ride-sharing in sales vehicles),” which is the highest among the emission factors for all commuting methods. For Group companies outside Japan, it is estimated by multiplying the number of employees of each company by the emission amount per employee calculated based on the result in Japan. |
| 8 | Upstream leased assets | Most leased assets are calculated as Scope 1 and 2 emissions. Scope 3 applies only to some leased assets (e.g., data centers). Calculated by multiplying the actual annual power consumption for the leased servers by a CO2 emission factor for electrical power. |
| 9 | Downstream transportation and distribution | Calculated for emissions related to distribution of Konica Minolta products sold by dealers. Estimated by identifying a CO2 emission factor per unit of sales based on the emissions from distribution for direct sales by the main sales companies and multiplying this by dealer sales volume. |
| 10 | Processing of sold products | Konica Minolta’s product lineup includes semi-finished product. Emissions in this category are calculated by identifying a CO2 emission factor per unit of sales based on the Scope 1 and Scope 2 emissions and sales volume of the main parts sales destinations and multiplying this by overall sales volume. |
| 11 | Use of sold products | Calculated by multiplying the number of units operating in the market (inferred from sales units each year and the life of the product) by the estimated annual amount of electrical consumption* of each model and a CO2 emission factor (For Japan, the national average emission factor is published by the Ministry of the Environment. For countries outside Japan, the value is the 2022 World "Total" value of "CO2 emissions per kWh of electricity only" from IEA Emissions Factors 2024). The calculation method used by Konica Minolta is slightly different from the GHG Protocol method, but it enables the Group to calculate the emissions that more accurately reflect the Group's business operations and thus allows it to implement initiatives to reduce CO2 emissions smoothly. |
| 12 | End-of-life treatment of sold products | Calculated for emissions related to the end-of-life treatment of products themselves and their containers and packaging. Calculated by multiplying the weight of materials that make up the products sold by a CO2 emission factor for each type of disposal method. The calculation is made for anticipated future emissions from the end-of-life treatment of products sold in the previous fiscal year, which will be reported as the data of that fiscal year. |
| 13 | Downstream leased assets | Calculated for buildings and equipment leased from Konica Minolta to third parties, by multiplying the actual value of annual energy consumption of leased equipment by the CO2 emission coefficients. |
| 14 | Franchises | Emissions from Kinko’s franchises in Kyushu, Hiroshima, and Shikoku fall under this category. Estimated based on the proportion of employees, based on energy usage at the head office of Kinko's Japan Co., Ltd. |
| 15 | Investments | Calculated for the emissions from the main companies in Konica Minolta’s investment portfolio, in which Konica Minolta holds specified investment stocks and from its equity-method affiliates. Calculated by multiplying the invested companies’ CO2 emissions by Konica Minolta’s shareholding ratio (%) in those companies (number of shares held by Konica Minolta / number of shares issued). |
- *
- The annual amount of electrical consumption for office equipment is estimated based on the Typical Electricity Consumption (TEC Ver 2.0) value set by the International Energy Star Program, and for equipment for healthcare system it is estimated based on each product's specifications.