
 Search within the site
Calculation Method for Avoided
Emissions
Konica Minolta's Approach to Avoided Emissions
Konica Minolta quantifies the contribution of its products to reducing GHG* emissions in its customers' supply chains as "avoided emissions." By expanding these avoided emissions, the Company aims to achieve both the resolution of social issues and business growth.
*GHG: Greenhouse gas
Avoided GHG emissions* are an indicator of the GHG reduction achieved by introducing a product, calculated by comparison with a reference scenario in which the product is not introduced. In calculating avoided emissions, Konica Minolta refers to the Guidance on Avoided Emissions v2.0 (hereinafter, the "WBCSD Guidance") issued by the WBCSD.
*Avoided GHG emissions: In accordance with the terminology used in the WBCSD Guidance, greenhouse gas emissions, including CO2, are expressed on this page in terms of CO2 equivalent (CO2e). "Avoided CO2 emissions," which Konica Minolta has established as a non-financial target, has the same meaning as avoided GHG emissions.
Furthermore, Konica Minolta quantifies the contribution of its products to reducing natural resource* usage in its customers' supply chains as the contribution to natural resource usage reduction. The contribution to natural resource usage reduction is calculated using the weight of raw materials procured determined during the calculation of avoided GHG emissions.
*Natural resources: Resources that involve new extraction, such as crude oil and mineral resources, and are generally synonymous with exhaustible resources.
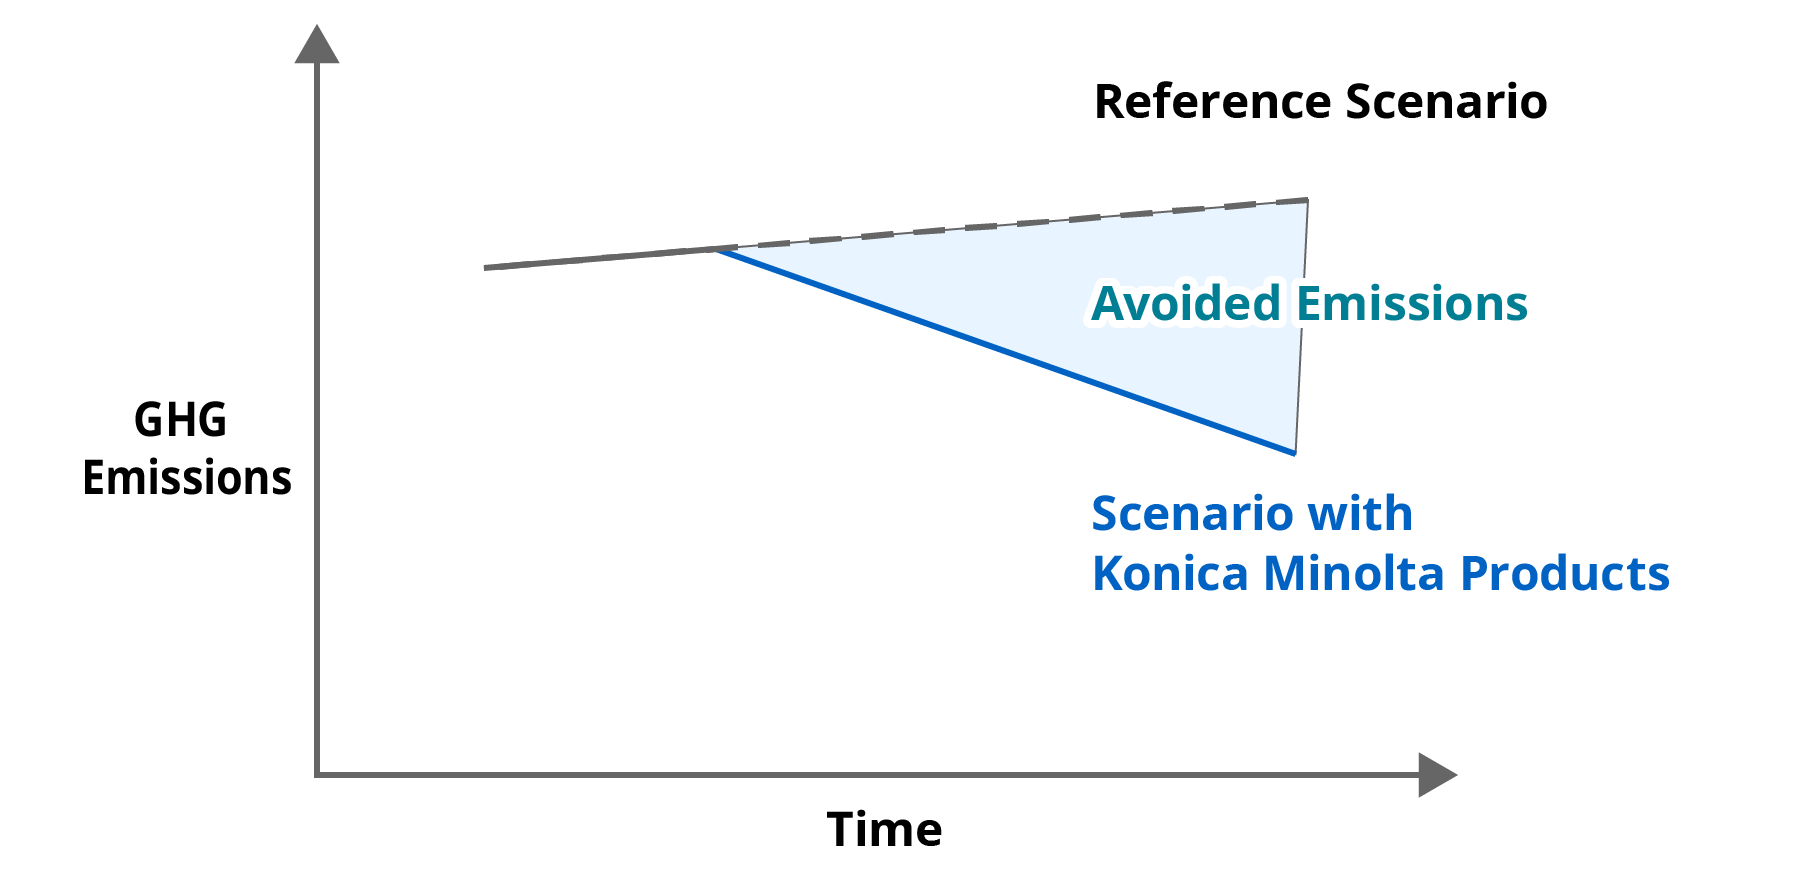
Avoided GHG emissions are fundamentally different from Konica Minolta's Scope 1, 2, and 3 emissions and cannot be used to justify delaying the achievement of Scope 1, 2, and 3 reduction targets or to offset Scope 1, 2, and 3 emissions.
In addition, based on the WBCSD Guidance, Konica Minolta verifies the following for all products for which avoided emissions are calculated:
- In calculating avoided GHG emissions, Konica Minolta confirms that the product passes the three Eligibility Gates*1.
- Avoided GHG emissions are not used to offset Konica Minolta's GHG emissions inventory or product CFP*2, or to make net-zero claims.
- For all products, no trade-offs (worsening of environmental aspects during the product lifecycle outside the scope evaluated for avoided emissions) or rebounds (an increase in lifecycle GHG emissions due to increased adoption of the product that exceeds the avoided GHG emissions) have been identified.
- There is no internationally standardized methodology for calculating avoided emissions, leaving room for interpretation by individual companies. Furthermore, uncertainties remain in establishing hypotheses for reference scenarios and assumptions, as well as in the use of secondary data.
- When Konica Minolta supplies only intermediate products, the WBCSD Guidance leaves it optional to determine how the avoided emissions generated by the final product are allocated. To avoid overestimating its own contribution while appropriately evaluating the impact of its products with competitive advantages, Konica Minolta determines the contribution ratio according to the following flowchart.
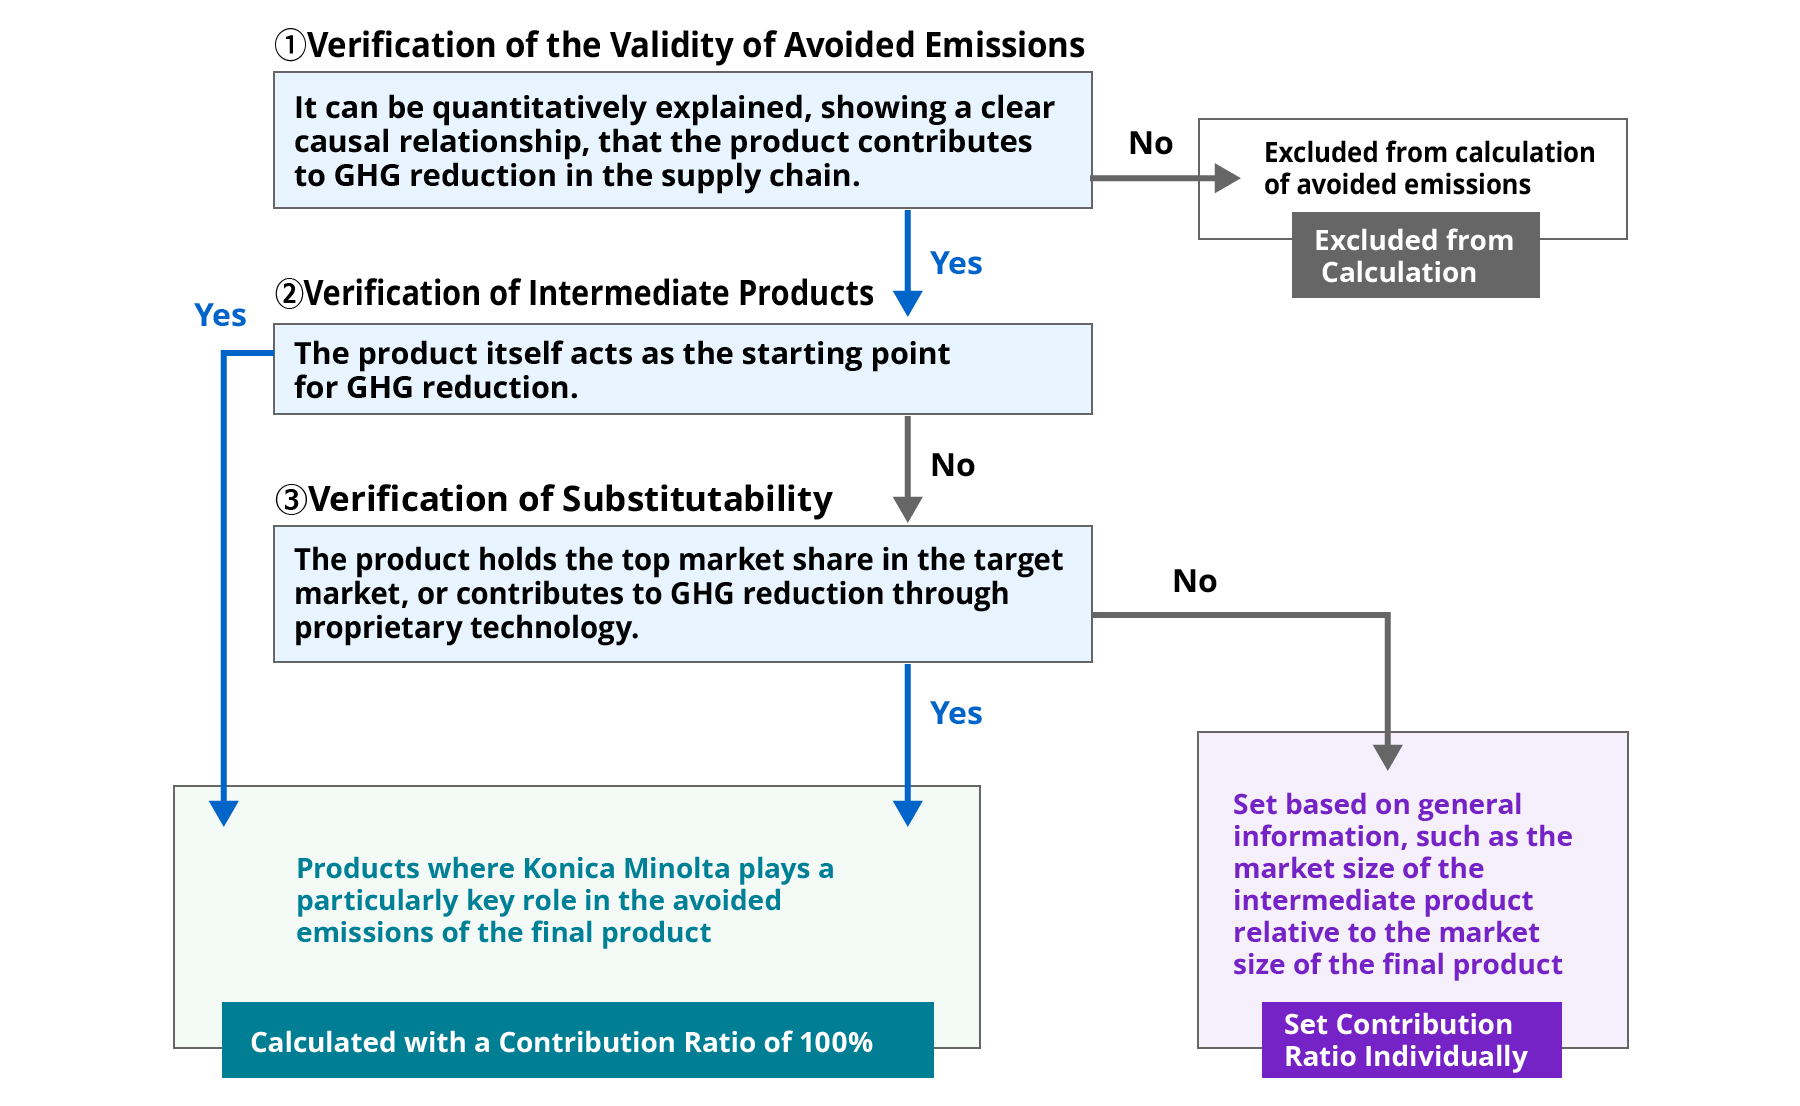
*1:Three Eligibility Gates: Three mandatory requirements under the WBCSD Guidance that must be satisfied when claiming a product's avoided emissions.
- Gate 1:The company sets GHG emission reduction targets aligned with a 1.5°C trajectory and reports performance.
- Gate 2:The claimed reduction effect is scientifically proven.
- Gate 3:The company explains the causal relationship demonstrating that the product delivers sufficient avoided emissions.
*2:Product CFP (Carbon Footprint): The amount of CO2 emitted during the lifecycle of a product, from raw material procurement to disposal.
FY2025 Results
In FY2025, the avoided GHG emissions from products sold by Konica Minolta reached 1,118 thousand t-CO2e*, and the percentage of revenue accounted for by products generating avoided GHG emissions was approximately 10%.
*CO2e: A unit expressing the amount of GHG (greenhouse gas) converted to the equivalent amount of CO2 that produces the same global warming potential.
| Target Products | Avoided GHG Emissions |
|---|---|
| Digital Printing Press | 809 thousand t-CO2e* |
| Cinema Projector Lens | 178 thousand t-CO2e |
| Hyperspectral Imaging Camera | 67 thousand t-CO2e |
| Inkjet System for Solder Resist Application Inkjet Printhead for Commercial Printing | 62 thousand t-CO2e |
| Anti-Reflection Film for OLED TVs | 0.86 thousand t-CO2e |
| Total | 1,118 thousand t-CO2e |
*The annual avoided GHG emissions of Accurio series digital printing presses are subject to third-party assurance in the Environmental Data (PDF).
Detailed Calculation Methods for Each Product and Solution
Digital Printing Press Accurio Series
Target Solution
Digital Printing Press Accurio Series
Comparison Target
Average Sheetfed Offset Printing Press on the Market
FY2025 Avoided Emissions
Annual avoided GHG emissions: 809 thousand t-CO2e/year*
*This result is subject to third-party assurance in the Environmental Data (PDF).
Annual contribution to natural resource usage reduction: 404 thousand tons/year
Overview
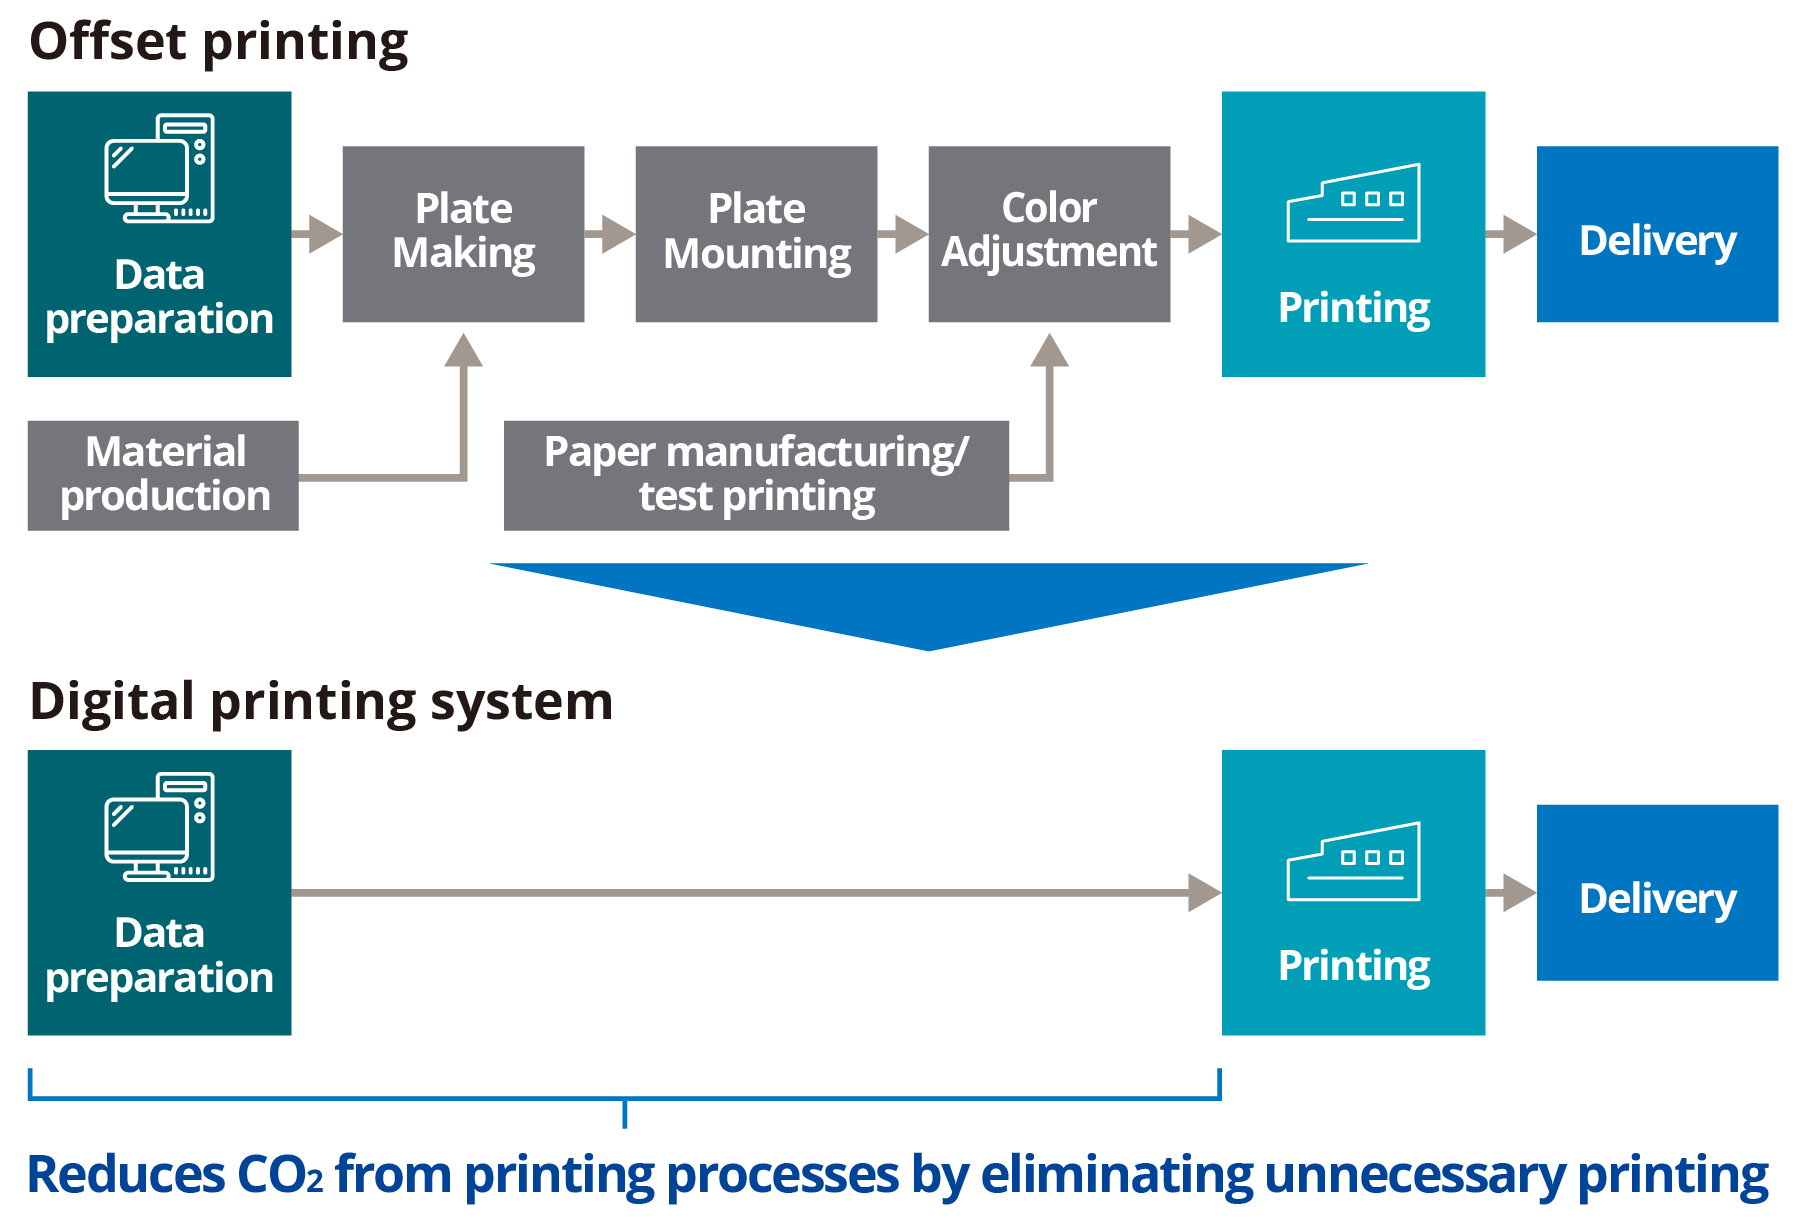
Digital printing is a technology that prints directly onto paper from digital data without the use of printing plates. Compared to offset printing, it eliminates the need for plate making and minimizes color adjustment during setup, thereby contributing to GHG reductions associated with plate procurement as well as waste paper (paper that does not become part of the finished product) generated during test printing and color adjustments, particularly in short-run printing.
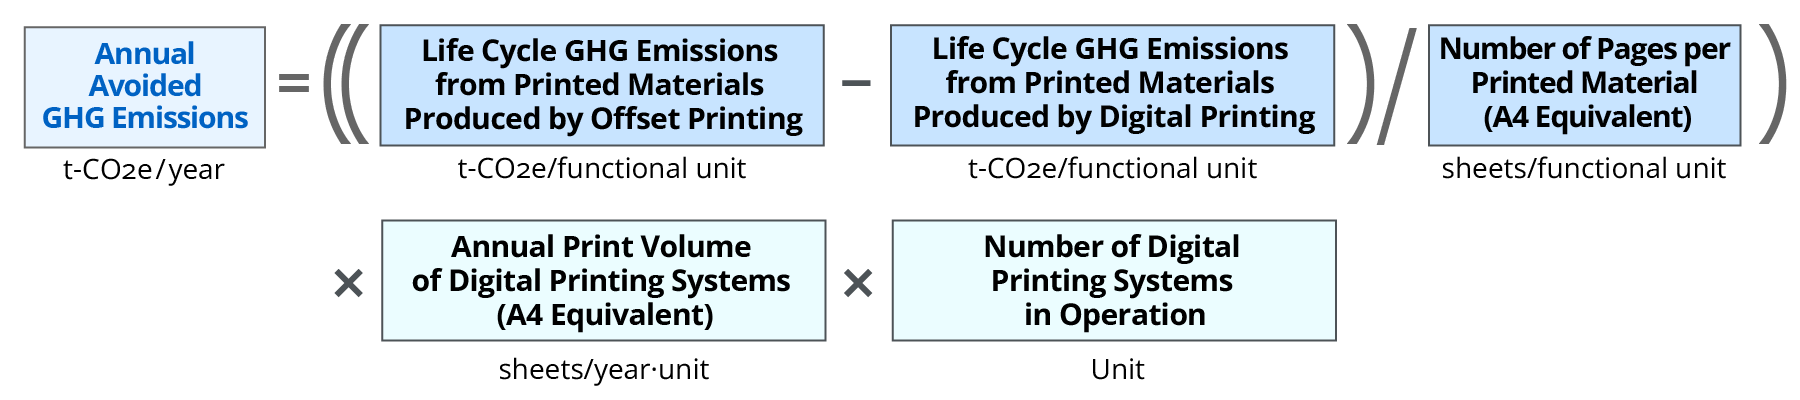
Calculation Formula
Assumptions
- This calculation references SuMPO EPD's PCR "Publishing, Commercial and General Security Printed Matters [6th Edition]" in order to comprehensively cover the life cycle of the target printed materials and align the calculation conditions for digital and offset printing.
- Avoided GHG emissions are calculated by evaluating the difference in life cycle GHG emissions between the target solution and the comparison target when each is used to print 150-250 copies (with the assumed print volume set for each model category) of a 48-page, A4-size color brochure.
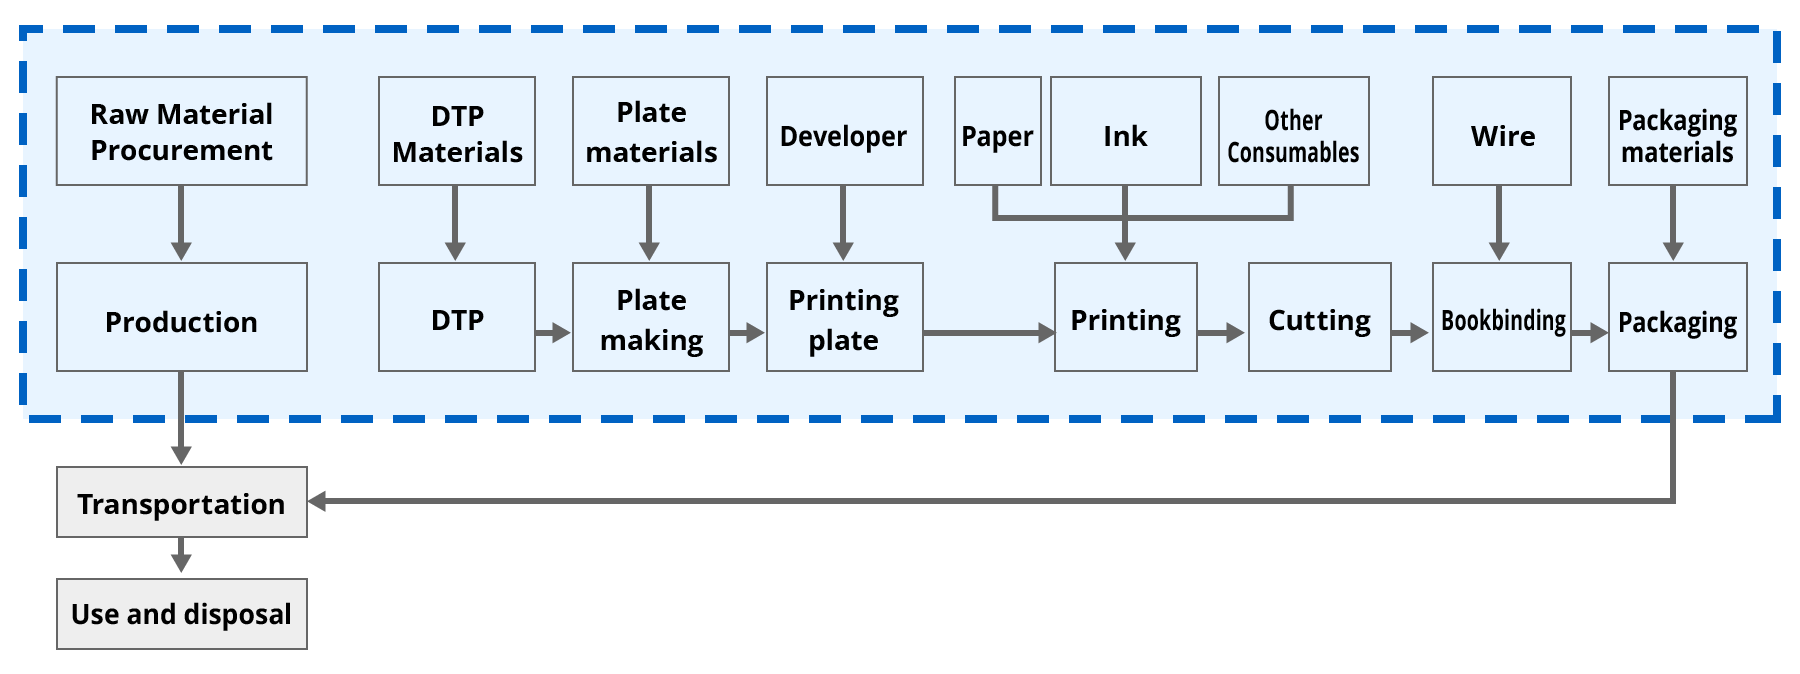
- Under the above PCR, the calculation scope for avoided GHG emissions covers raw material procurement (plates, printing paper, ink, etc.) and the manufacturing stage (printing process) required to produce the printed materials. Processes following the transportation of printed materials are considered identical for both and are omitted from the calculation.
- Reductions in inventory loss are excluded from the calculation due to high uncertainty.
- GHG emissions from raw material procurement, manufacturing, transportation, and disposal of the printing presses themselves are not included in this calculation. However, Konica Minolta has confirmed that there is no significant difference between offset and digital printing presses in these emissions compared with those from the printing process, and that the difference in GHG emissions from printing accounts for a large proportion of the overall difference.
Timeframe
The calculation period is one year (FY2025). Assuming that products sold over the four years since FY2022 are operating in the market, the total effect attributable to Konica Minolta's products is calculated by multiplying the effect per unit by the number of units operating in the market.
Analysis Results
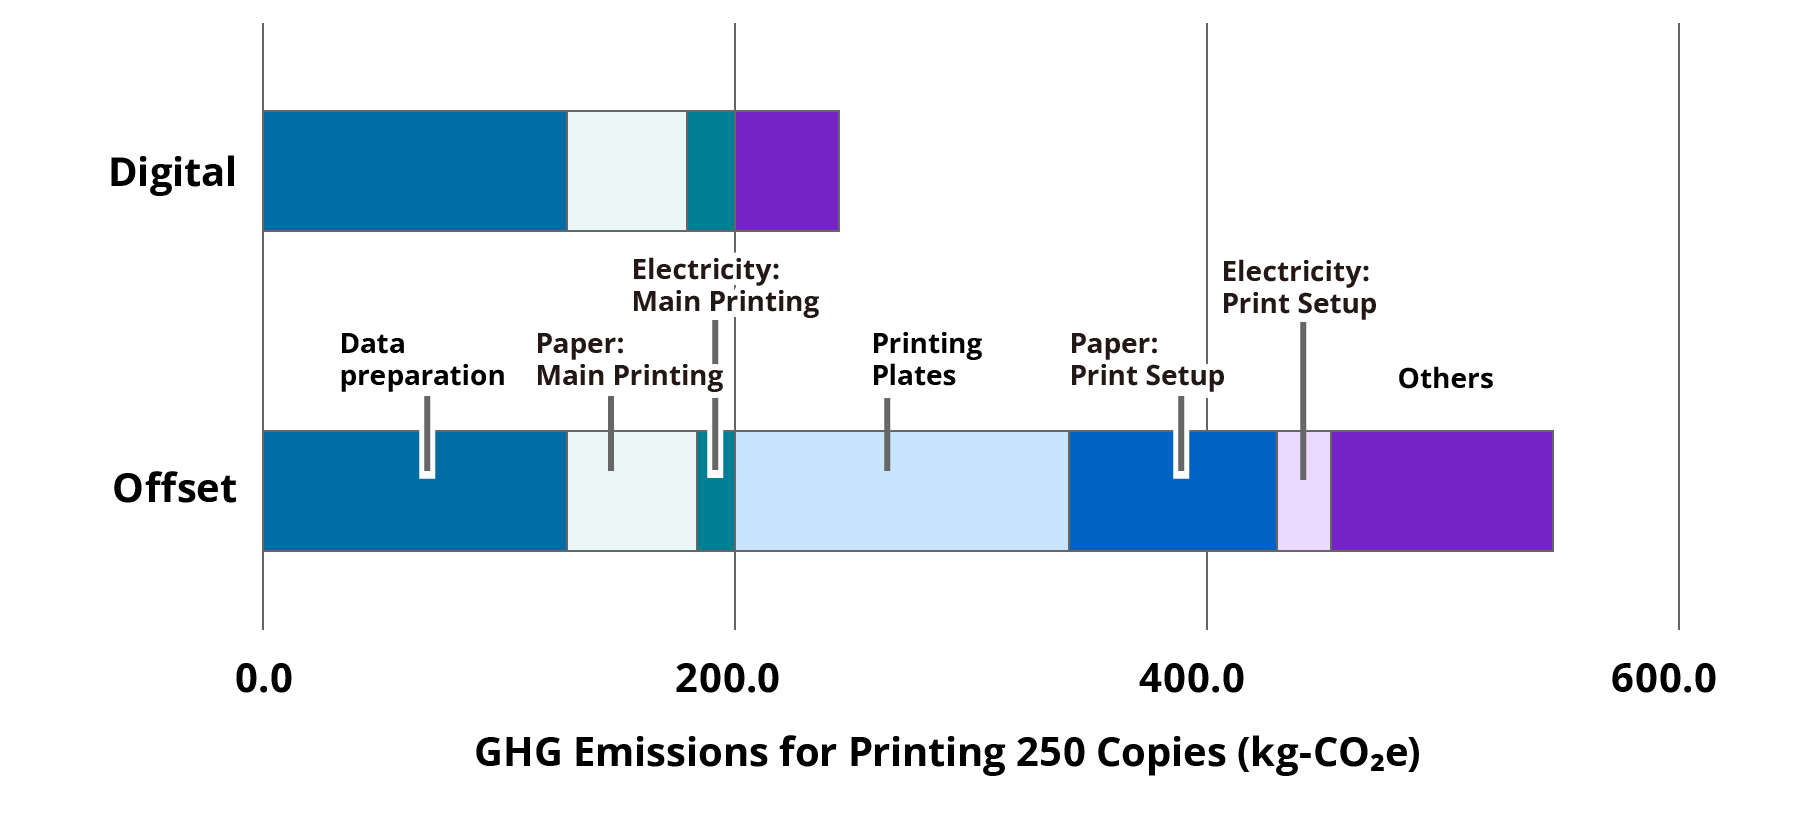
The first chart below plots the calculated GHG emissions per A4 sheet for various print volumes. The smaller the print volume (short run), the larger the difference in GHG emissions. The second chart below shows the results for a print run of 250 copies, as assumed in the calculation. The primary drivers of the difference are the procurement of aluminum for printing plates, as well as the paper and electricity used during test printing.
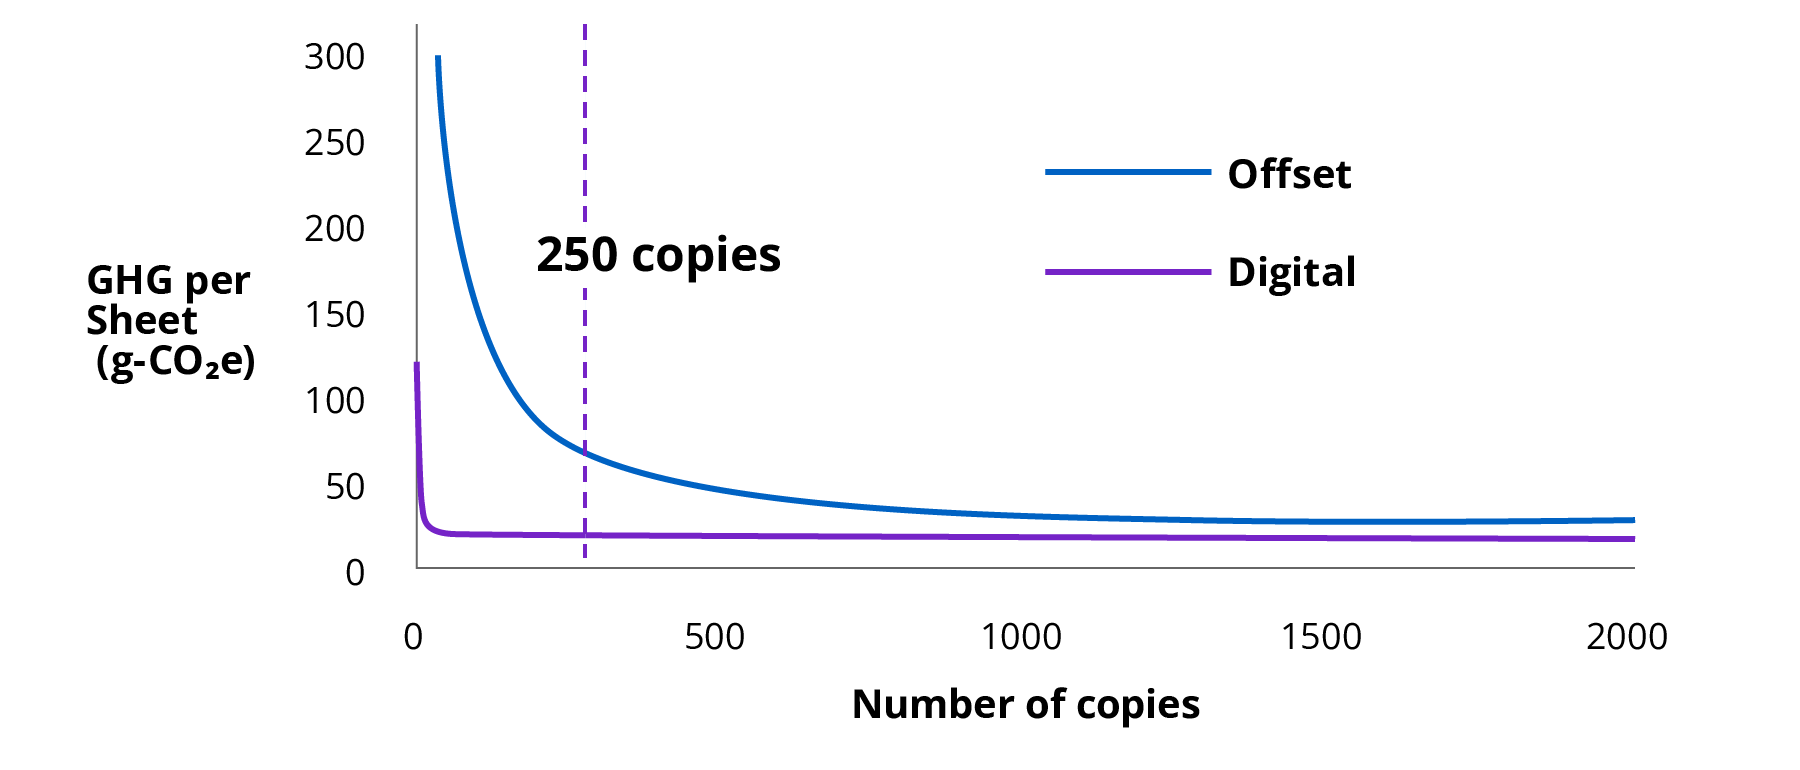
*1:The graph is based on data for the B2 inkjet press. Other models show a similar trend.
| Model Category | Comparison Target | Assumed Print Volume | Avoided GHG Emissions per A4 Sheet*2 |
|---|---|---|---|
| B2 Inkjet Press | Full-Size Sheetfed Offset Press | 250 copies | 50.6 g-CO2e/sheet |
| A3 Electrophotographic Digital Press (High-Speed Class) | Half-Size Sheetfed Offset Press | 200 copies | 63.6 g-CO2e/sheet |
| A3 Electrophotographic Digital Press (Mid-Speed Class) | Half-Size Sheetfed Offset Press | 150 copies | 85.3 g-CO2e/sheet |
*2:The avoided GHG emissions per A4 sheet are the average of the values calculated for models in the same category.
Calculation Basis
- The target printed material (a 48-page, A4-size color brochure) is based on average data registered with SuMPO EPD under the aforementioned PCR.
- Print volumes are modeled based on Konica Minolta's measurements and multiple publicly available sources.
- Taking errors in post-printing processes into account, a 1% allowance is included in the calculation for digital printing presses.
On the other hand, offset presses are known to conventionally print 5–10% extra due to the high cost of reprinting. Therefore, a 5% allowance is included in the calculation for offset presses. - Digital printing accounts for 15–20% of the printing market, with analog printing remaining mainstream. Therefore, an average sheetfed offset printing press in the market was selected as the comparison target. Although the share of digital printing is expected to grow by approximately 5 percentage points from 2020 to 2025, findings based on the sales scale and usage of digital printing presses confirm that digital printing presses are generating new demand by serving as alternatives to offset presses, particularly in short-run printing.
Assessment Based on the WBCSD Guidance
- In this calculation, Konica Minolta has confirmed that the three Eligibility Gates are satisfied:
Gate 1: Konica Minolta's SBT net-zero target has been validated.
Gate 2: This effect contributes to the "Energy Efficiency" and "Material Efficiency" mitigation measures identified in IPCC AR6.
Gate 3: Based on the diagram above, GHG emissions are reduced mainly through reductions in printing plates and paper. - Konica Minolta has confirmed that no trade-offs occur because GHG emissions from raw material procurement, manufacturing, transportation, and disposal of the printing presses themselves do not differ significantly between offset and digital printing presses compared with emissions from the printing process, and the difference in GHG emissions from printing accounts for a large proportion of the overall difference.
- The annual avoided GHG emissions of digital printing presses in this series are subject to third-party assurance in the Environmental Data (PDF).
Limitations
These calculation results are based on the above assumptions, and actual GHG reduction effects will vary depending on operating conditions.
Cinema Projector Lens
Target Solution
Cinema laser-illuminated projectors using Konica Minolta lens units
Comparison Target
Cinema xenon-lamp projectors using market-average lens units
FY2025 Avoided Emissions
Annual avoided GHG emissions: 178 thousand t-CO2e/year
Overview
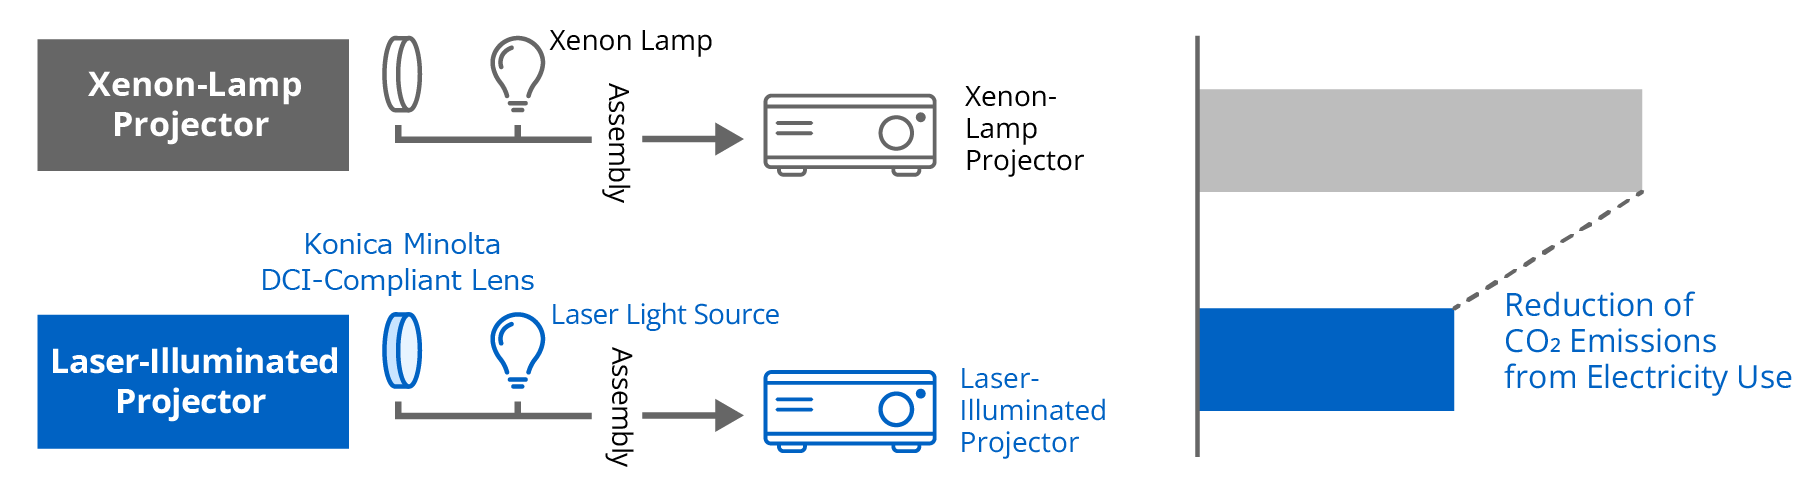
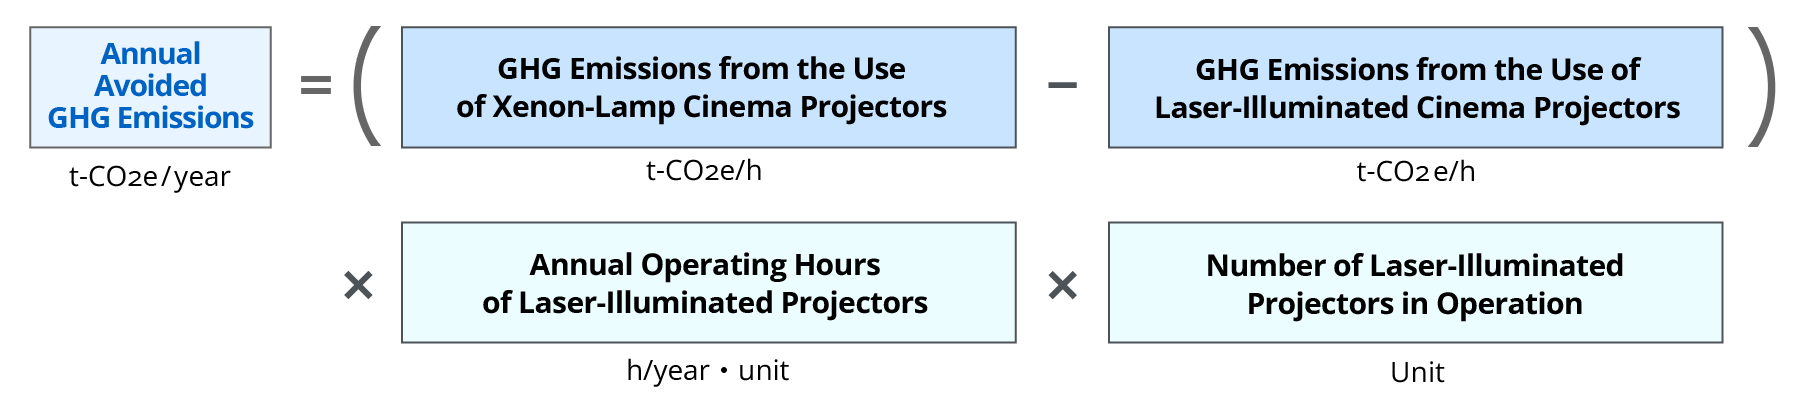
Projectors using laser light sources can project images with lower power consumption than conventional projectors using xenon light sources. Thanks to their ability to project high-definition images using laser light sources, Konica Minolta's lens units enable laser projectors to replace conventional xenon-lamp projectors. Konica Minolta's lenses command a market share of over 60% (estimated by Konica Minolta) in the market for DCI (Digital Cinema Initiatives)*1-compliant lenses for DLP (Digital Light Processing)*2 cinema projectors, making a major contribution to reducing GHG emissions associated with projector power consumption.
*1:An organization formed by five major Hollywood film studios that sets international standards for digital cinema projection.
DCI (Digital Cinema Initiatives)opens in a new window
*2:A projection technology widely used in digital cinema.
Calculation Formula
Assumptions
- Avoided GHG emissions are calculated by evaluating the difference in GHG emissions when both the target solution and the comparison target are operated for 8 hours per day and 350 days per year.
- The calculation scope is the use stage of the projector. GHG emissions from raw material procurement, manufacturing, transportation, and disposal are small compared with those from the use stage and are omitted from the calculation after confirming that there is little difference between the two types of projectors.
- For the calculation, projector panel sizes are classified into three categories (small, medium, and large), and power consumption is averaged across multiple representative projector models for each size.
- The avoided GHG emissions at the projector level are allocated to the lens.
Timeframe
The calculation period is one year (FY2025). Assuming that products sold since FY2017 operate over a product lifespan of 10 years, the total effect attributable to Konica Minolta's products is calculated by multiplying the effect per unit by the number of units operating in the market.
Analysis Results
The table below compares the power consumption (in kW) of laser-illuminated and xenon-lamp projectors for each panel size. Annual avoided GHG emissions are calculated by multiplying these figures by the corresponding number of projectors in operation in the market for each panel size.
| Panel Size | Application | Power Consumption Reduction through Laser Illumination |
|---|---|---|
| 0.69 | Mini Theaters, Small Auditoriums, etc. | △890 kW (59%) |
| 0.98 | Standard Theaters | △2,660 kW (37%) |
| 1.38 | Premium Large-Screen Theaters | △2,400 kW (69%) |
Calculation Basis
- Projector power consumption was calculated by selecting two laser-illuminated models and two xenon-lamp models for each panel size and taking the average.
- Product lifespan was set to 10 years, as required for DCI-compliant lenses, assuming that the projector itself has an equivalent lifespan.
- Operating hours were set assuming movie theaters operate daily, including holidays.
- The number of units operating in the market for each panel size was estimated using internal survey data on the number of screens in the market and lens shipment volumes.
- Considering market share trends for laser-illuminated and xenon-lamp projectors and the fact that the adoption of laser light sources has expanded since 2015, calculations assume that products sold in 2025 replace xenon-lamp projectors.
Assessment Based on the WBCSD Guidance
- In this calculation, Konica Minolta has confirmed that the three Eligibility Gates are satisfied.
Gate 1: Konica Minolta's SBT net-zero target has been validated.
Gate 2: This effect contributes to the "Energy Efficiency" mitigation measure identified in IPCC AR6.
Gate 3: Based on the diagram above, GHG emissions are reduced mainly through lower power consumption. - GHG emissions from raw material procurement, manufacturing, transportation, and disposal of cinema projectors are small compared with those from the use stage. Furthermore, since GHG emissions from laser-illuminated projectors are equal to or lower than those from xenon-lamp projectors at every life cycle stage, no trade-offs have been identified.
- Avoided GHG emissions from cinema projector lenses are not subject to third-party assurance.
Limitations
These calculation results are based on the above assumptions; actual GHG reduction effects will vary depending on operating conditions.
Hyperspectral Imaging Camera
Target Solution
Plastic recycling system using hyperspectral imaging
Comparison Target
Conventional plastic recycling system
FY2025 Avoided Emissions
Annual avoided GHG emissions: 67 thousand t-CO2e/year
Annual contribution to natural resource usage reduction: 21 thousand tons/year
Overview
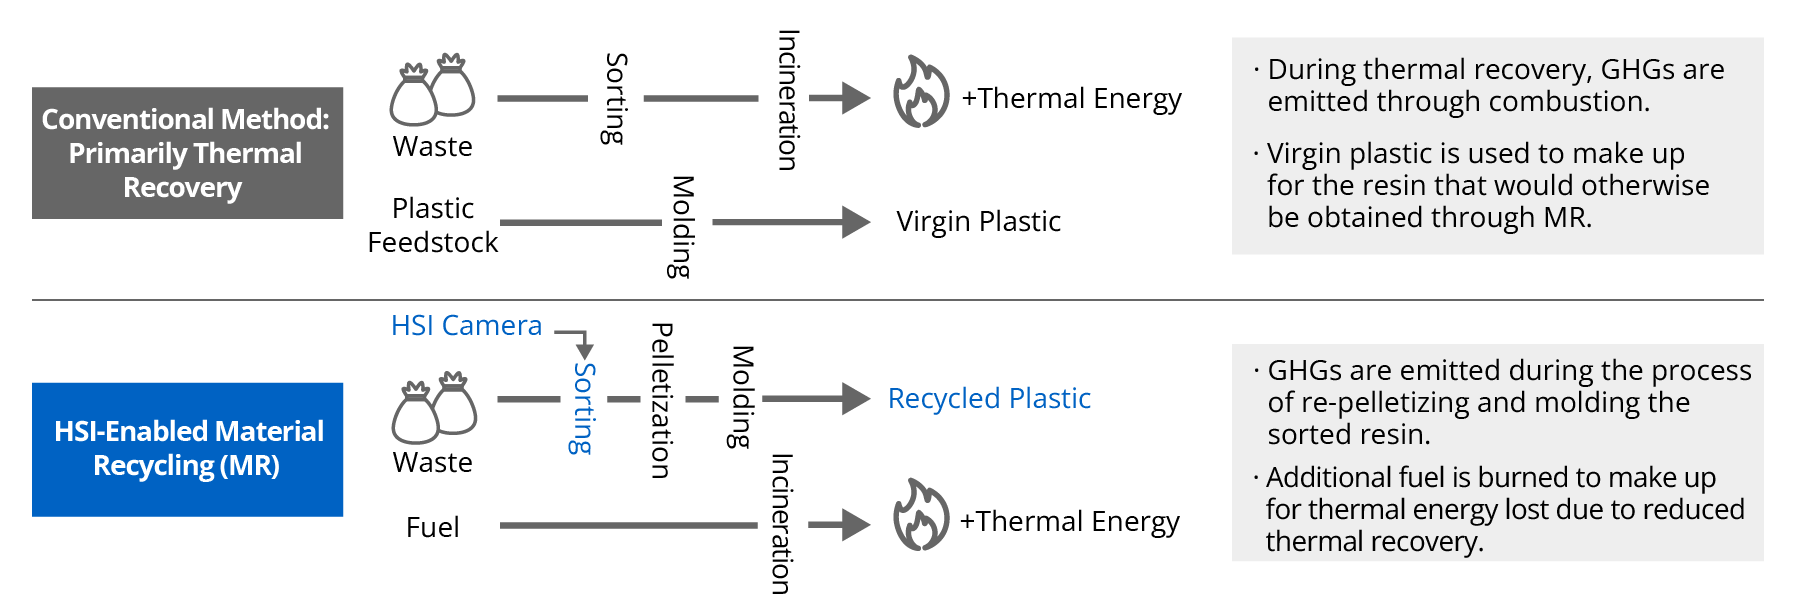
Achieving material recycling (MR) for plastics requires sorting resin types to a high level of purity. For general waste containing a mixture of various materials, conventional sorting methods alone cannot achieve sufficient purity, so the plastics are instead subjected to thermal recovery, resulting in CO2 emissions. Optical sorting using hyperspectral imaging (HSI) technology enables higher-purity resin sorting and contributes to reducing GHG emissions by replacing thermal recovery with material recycling.
Calculation Formula
Assumptions
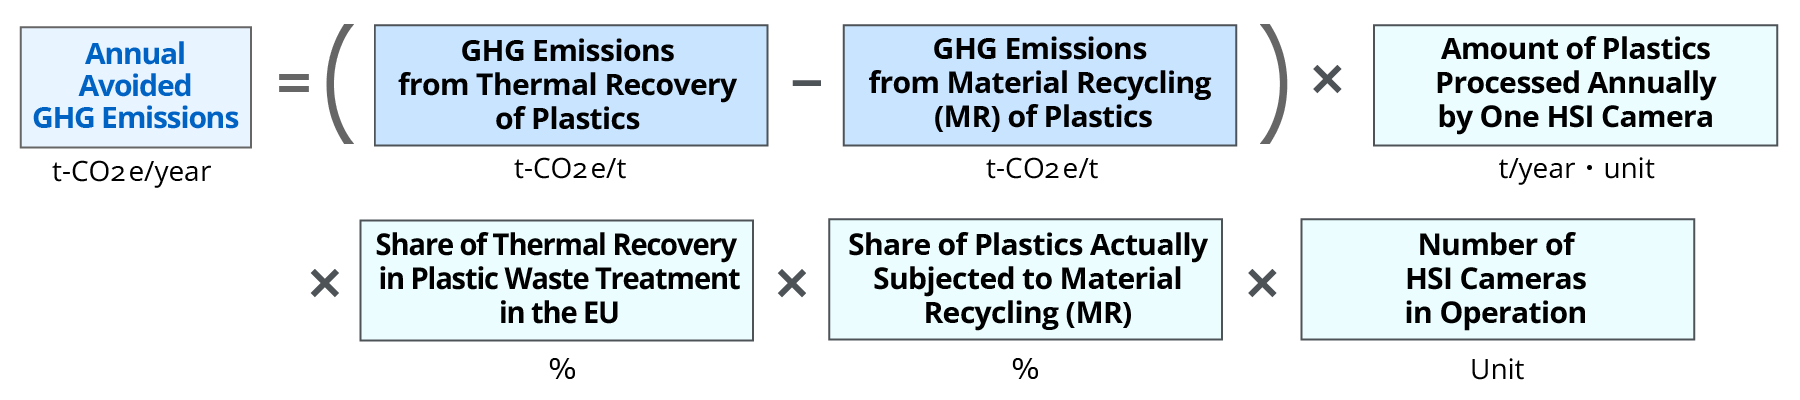
- Life cycle GHG differences are calculated based on the condition that the target solution operates 24 hours a day at an 80% operating rate for 250 days.
- The calculation scope covers the process from waste collection and transportation through treatment. The calculation also includes the production required to compensate for the thermal energy obtained through thermal recovery and the resin obtained through MR when the respective treatment method is not selected.
Timeframe
- The calculation period is one year (FY2025). Assuming that products sold in FY2020 and later operate over a 10-year product lifespan, the total effect attributable to Konica Minolta's products is calculated by multiplying the effect per unit by the number of units operating in the market.
Analysis Results
The table below compares life cycle CO2 emissions under the conventional method and with HSI implementation. Replacing thermal recovery with material recycling (MR) for one ton of plastic results in avoided GHG emissions of 3.20 t-CO2e.
| Thermal Recovery | Virgin Plastic Production | MR | Fuel Combustion | Total | |
|---|---|---|---|---|---|
| Conventional Method | 3.22 | 2.49 | ― | ― | 5.71 |
| With HSI | ― | ― | 0.88 | 1.63 | 2.51 |
| Difference | 3.20 |
Unit: t-CO2e
Calculation Basis
- The proportion of plastic contained in waste passing through the treatment system is set at 19%, based on data on EU packaging waste in 2021.
- The proportion of plastics treated in the EU that undergo thermal recovery or incineration is set at 30%, based on research data from the Japan Environmental Sanitation Center.
Japan Environmental Sanitation Center Research Dataopens in a new window
- The proportion of sorted plastic that is of sufficient quality for downstream MR is set at 23%. This is based on the proportion of collected plastic that passed through the MR process, as reported in Plastics Europe's The Circular Economy for Plastics – A European Analysis 2024.
The Circular Economy for Plastics – A European Analysis 2024opens in a new window
Assessment Based on the WBCSD Guidance
- In this calculation, Konica Minolta has confirmed that the three Eligibility Gates are satisfied.
Gate 1: Konica Minolta's SBT net-zero target has been validated.
Gate 2: This effect contributes to the "Material Efficiency" mitigation measure identified in IPCC AR6.
Gate 3: Based on the diagram above, GHG emissions are reduced mainly by replacing thermal recovery with MR. - No trade-offs were identified over the life cycle of this product.
- Avoided GHG emissions from HSI cameras are not subject to third-party assurance.
Limitations
These calculation results are based on the above assumptions; actual GHG reduction effects will vary depending on operating conditions.
Inkjet System for Solder Resist Application
Target Solution
Solder resist formation on printed circuit boards using inkjet technology
Comparison Target
Solder resist formation on printed circuit boards using conventional methods
FY2025 Avoided Emissions
Annual avoided GHG emissions: 62 thousand t-CO2e/year*
Annual contribution to natural resource usage reduction: 31 thousand tons/year*
*Combined figures for inkjet products (inkjet systems for solder resist application and inkjet printheads for commercial printing).
Overview
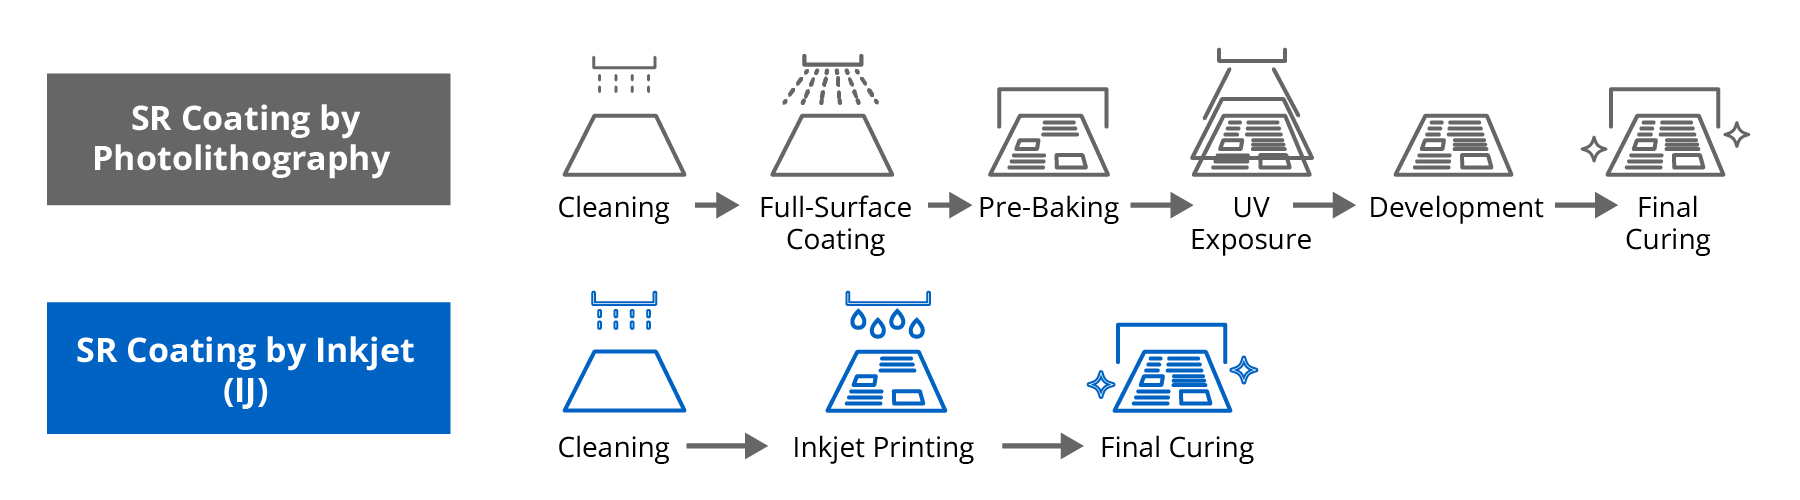
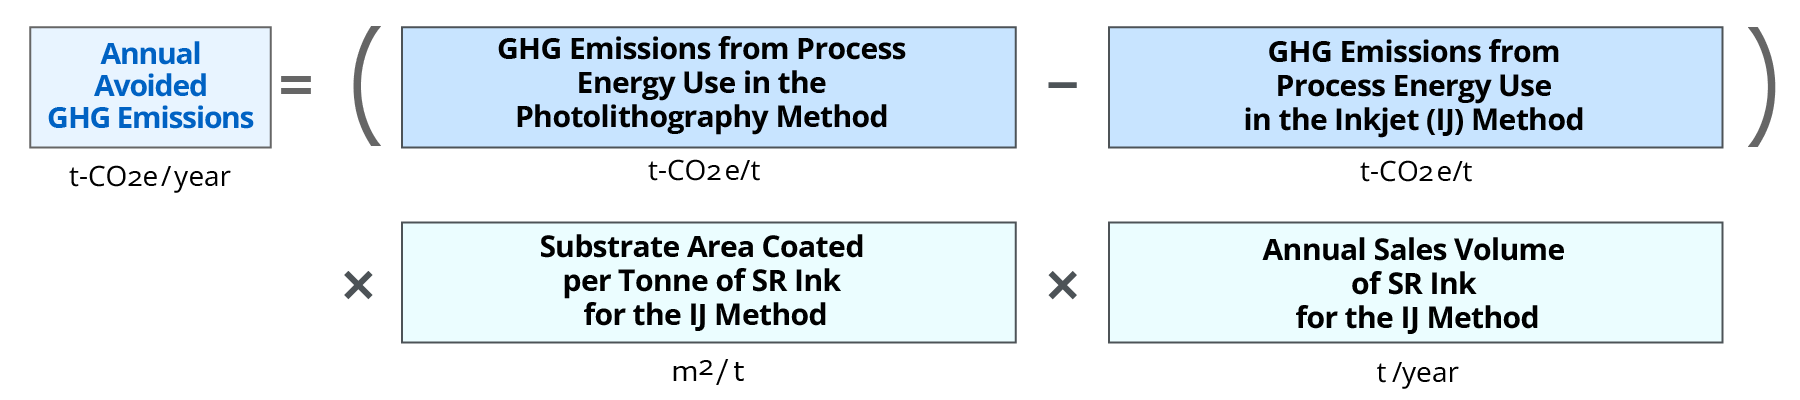
In the photolithography method currently used for solder resist (SR) formation on printed circuit boards, solder resist is applied across the entire surface, the required areas are cured by UV exposure, and the solder resist in unnecessary areas is washed away. In contrast, the inkjet (IJ) method applies solder resist only to the required areas from the start. This shortens the process and reduces energy consumption, thereby contributing to GHG emission reductions.
Calculation Formula
Assumptions
- Calculations are based on energy data collected from actual operations at multiple printed circuit board manufacturing plants.
- The calculation scope is limited to the SR formation process and covers the difference in energy consumption in the production processes being replaced and in shared equipment within the production area. While GHG emissions associated with the procurement and disposal of input materials are not included in this calculation, no trade-offs were identified because the amounts of ink, solvents, developers, and photomasks used and disposed of are all lower with the IJ method than with the conventional method.
Timeframe
The calculation period is one year (FY2025). Avoided GHG emissions per ton of ink are calculated based on the average values obtained from assessments at multiple companies and then multiplied by sales volume.
Analysis Results
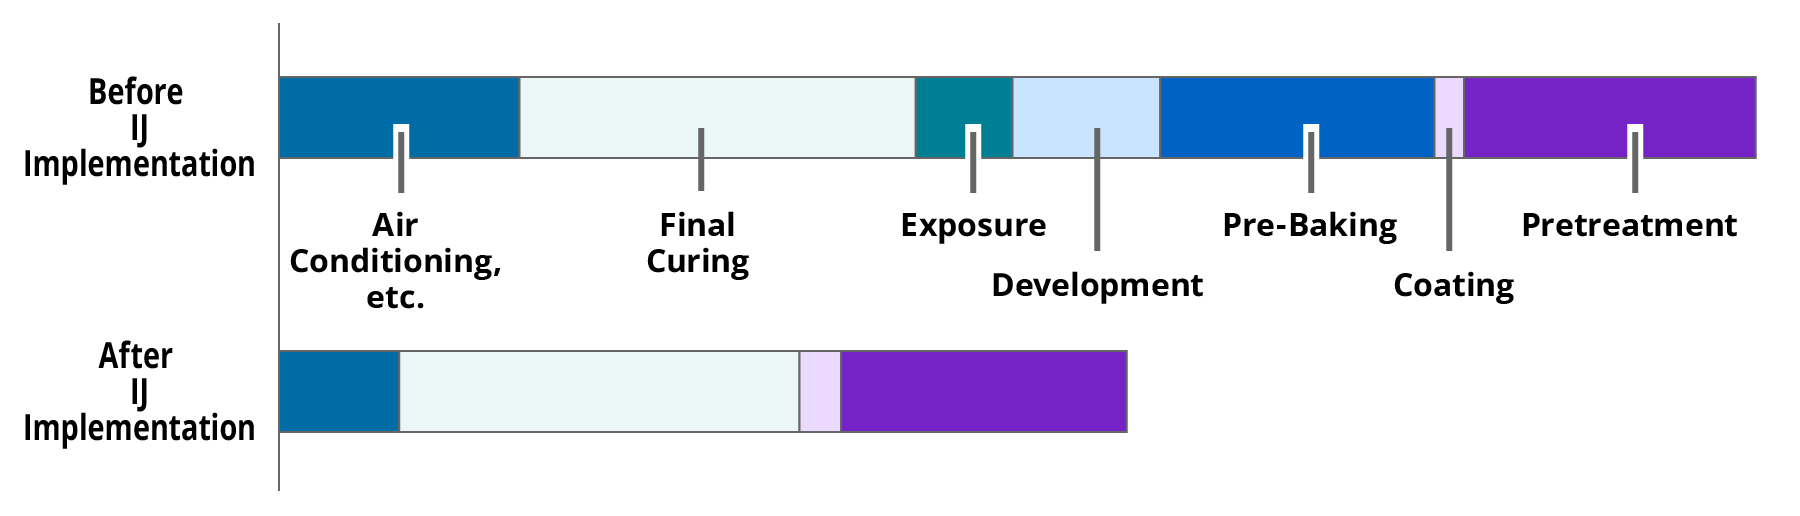
The figure below compares the energy load of the SR process under the conventional method and the IJ method. Verification at multiple plants confirmed that the energy load can be reduced by approximately 40%.
Calculation Basis
- Calculations for the IJ method are based on the condition of applying SR ink to 21.6 m2 of circuit boards per hour.
- Detailed process conditions vary among the plants where verification was conducted, but all of them manufacture rigid printed circuit boards using the photolithography method.
- The reduction in energy consumption by shared equipment (e.g., HVAC) was calculated based on the area ratio of the zones dedicated to pre-baking, exposure, and development—processes that are shortened by adopting the IJ method.
Assessment Based on the WBCSD Guidance
- In this calculation, Konica Minolta has confirmed that the three Eligibility Gates are satisfied.
Gate 1: Konica Minolta's SBT net-zero target has been validated.
Gate 2: This effect contributes to the "Energy Efficiency" mitigation measure identified in IPCC AR6.
Gate 3: Based on the diagram above, GHG emissions are reduced mainly through energy savings achieved by shortening the process. - No trade-offs were identified because the amounts of ink, solvents, developers, and photomasks used and disposed of are all lower with the IJ method than with the conventional method.
- Avoided GHG emissions from inkjet-based solder resist formation are not subject to third-party assurance.
Limitations
These calculation results are based on the above assumptions; actual GHG reduction effects will vary depending on operating conditions.
Inkjet Heads for Commercial Printing
Target Solution
Digital printing presses incorporating Konica Minolta inkjet heads
Comparison Target
Market-average analog printing presses
FY2025 Avoided Emissions
Annual avoided GHG emissions: 62 thousand t-CO2e/year*1
Annual contribution to natural resource usage reduction: 31 thousand tons/year*1
*1:Combined figures for inkjet products (inkjet systems for solder resist application and inkjet heads for commercial printing).
Overview
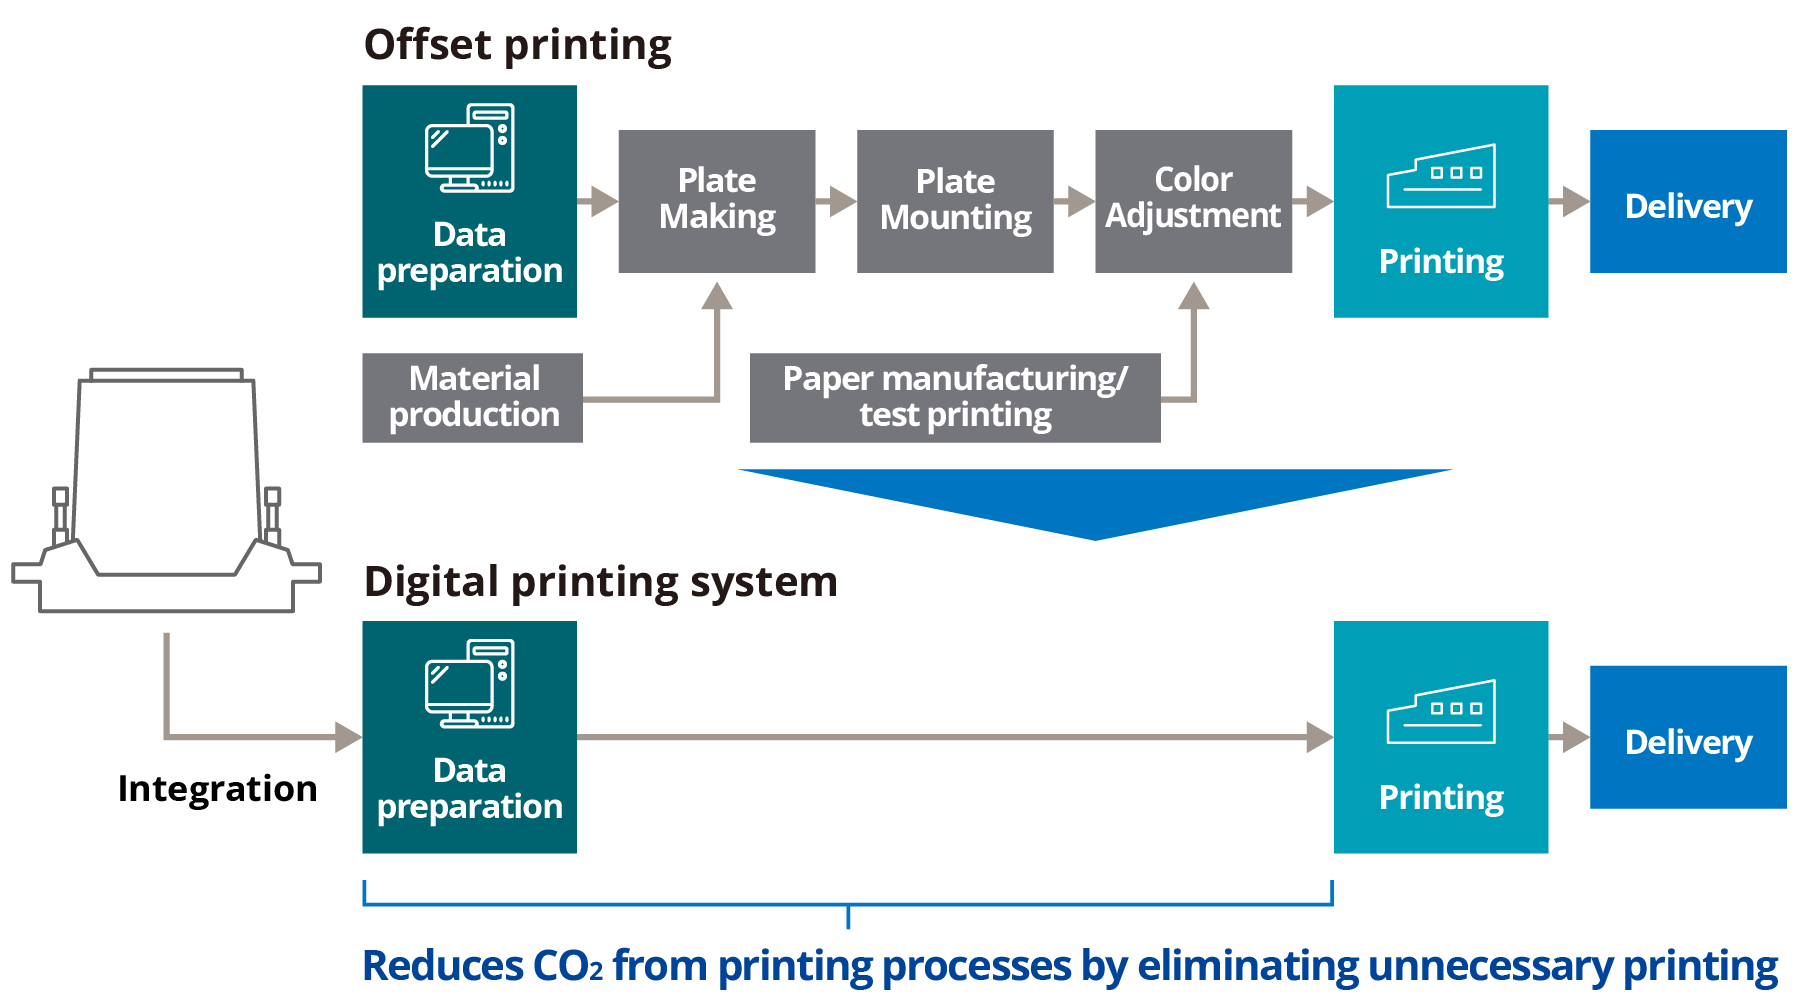
Digital printing technology enables on-demand production and contributes to GHG reductions by reducing the number of steps in the printing process. Konica Minolta's inkjet heads (IJ heads) feature high durability and application-specific customizability, helping digitize printing across a wide range of media.
Calculation Formula

Assumptions
- Industrial printing presses are evaluated under the same printing conditions as those used for Konica Minolta's Accurio series digital printing systems.
- To avoid double counting within the company, IJ heads incorporated into Konica Minolta's own digital printing presses are excluded from the calculation; calculations cover only IJ heads sold for integration into third-party digital printing presses.
Timeframe
The calculation period is one year (FY2025). Assuming that products sold in FY2022 and later operate over a four-year product lifespan, the total effect attributable to Konica Minolta's products is calculated by multiplying the effect per unit by the number of units operating in the market.
Analysis Results
The avoided GHG emissions from digital printing presses incorporating Konica Minolta IJ heads are shown in the table below.
| Application | Reduction Effect | Contribution of IJ Heads |
|---|---|---|
| Commercial Printing Systems | Reduction in Printing Plates and Test Prints | 13% |
*The avoided GHG emissions per printing press are calculated with reference to the calculation results for Konica Minolta's Accurio series and adjusted to reflect the specifications of the equipment in which the IJ heads are installed.
Calculation Basis
- In this calculation, the contribution of IJ heads to the avoided GHG emissions of each printing press is applied as a "contribution ratio." This contribution ratio is determined based on the ratio of the market size on a per-head basis to the market size on a per-printing-press basis.
- The number of IJ heads installed per digital printing press is based on a standard figure derived from past performance. The number of third-party machines equipped with Konica Minolta IJ heads and operating in the market is calculated by dividing the number of heads sold by the number of heads installed per unit for each application.
Assessment Based on the WBCSD Guidance
- In this calculation, Konica Minolta has confirmed that the three Eligibility Gates are satisfied.
Gate 1: Konica Minolta's SBT net-zero target has been validated.
Gate 2: This effect contributes to the "Energy Efficiency" and "Material Efficiency" mitigation measures identified in IPCC AR6.
Gate 3: Based on the diagram above, GHG emissions are reduced through reductions in process steps and materials achieved by replacing analog printing with digital printing. - In the Accurio series calculations, GHG emissions from raw material procurement, manufacturing, transportation, and disposal of the printing presses themselves were confirmed to be very small compared with GHG emissions from the printing process, and no trade-offs have been identified.
- Avoided GHG emissions from IJ heads for commercial printing are not subject to third-party assurance.
Limitations
These calculation results are based on the above assumptions; actual GHG reduction effects will vary depending on operating conditions.
Anti-Reflection Film for OLED TVs
Target Solution
Konica Minolta anti-reflection film for OLED TVs
Comparison Target
Conventional anti-reflection film for OLED TVs
FY2025 Avoided Emissions
Annual avoided GHG emissions: 0.86 thousand t-CO2e/year
Annual contribution to natural resource usage reduction: 0.21 thousand tons/year
Overview
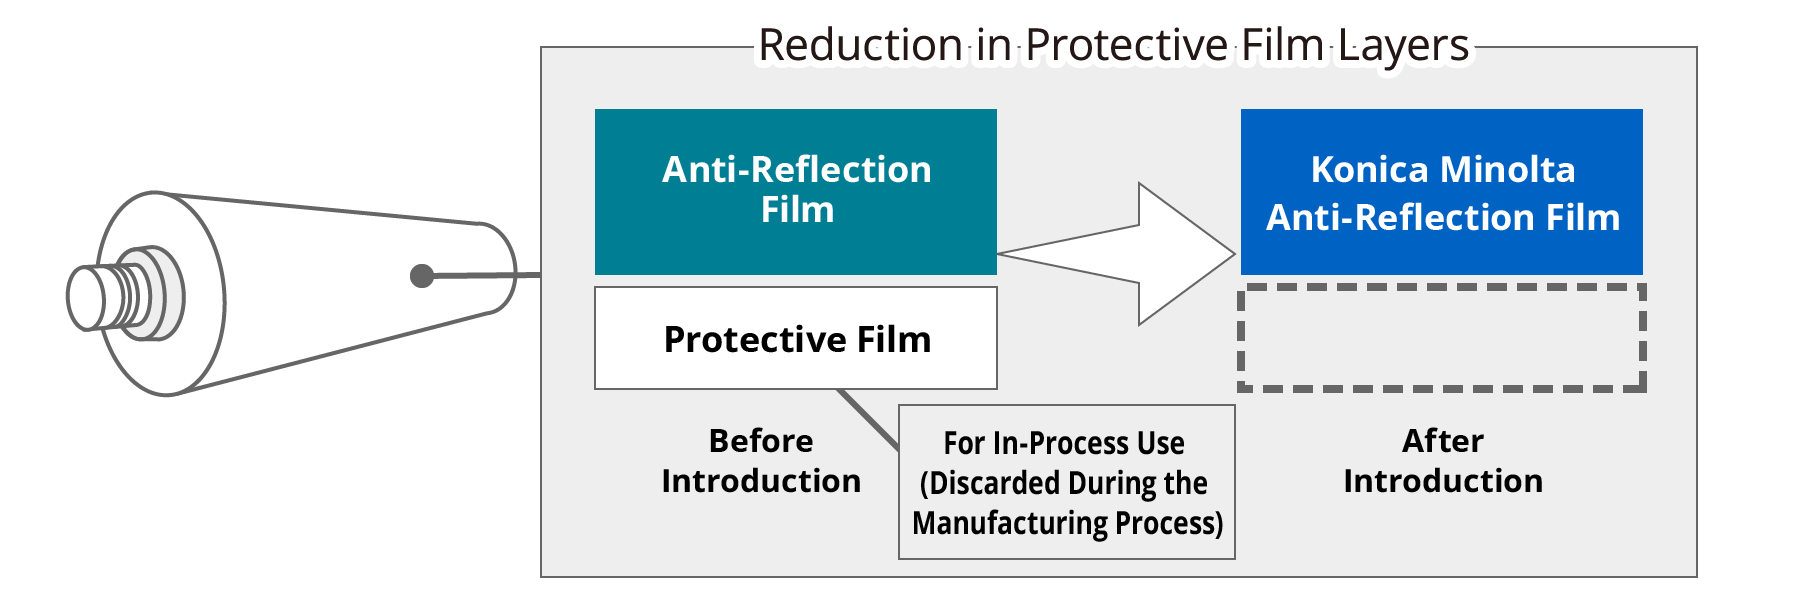
TV screens consist of multiple film layers that serve various functions. The use of Konica Minolta's anti-reflection film for OLED TVs eliminates the need for the protective film used with conventional anti-reflection films and discarded during the manufacturing process, thereby contributing to reductions in GHG emissions associated with the manufacture of the protective film.
Calculation Formula
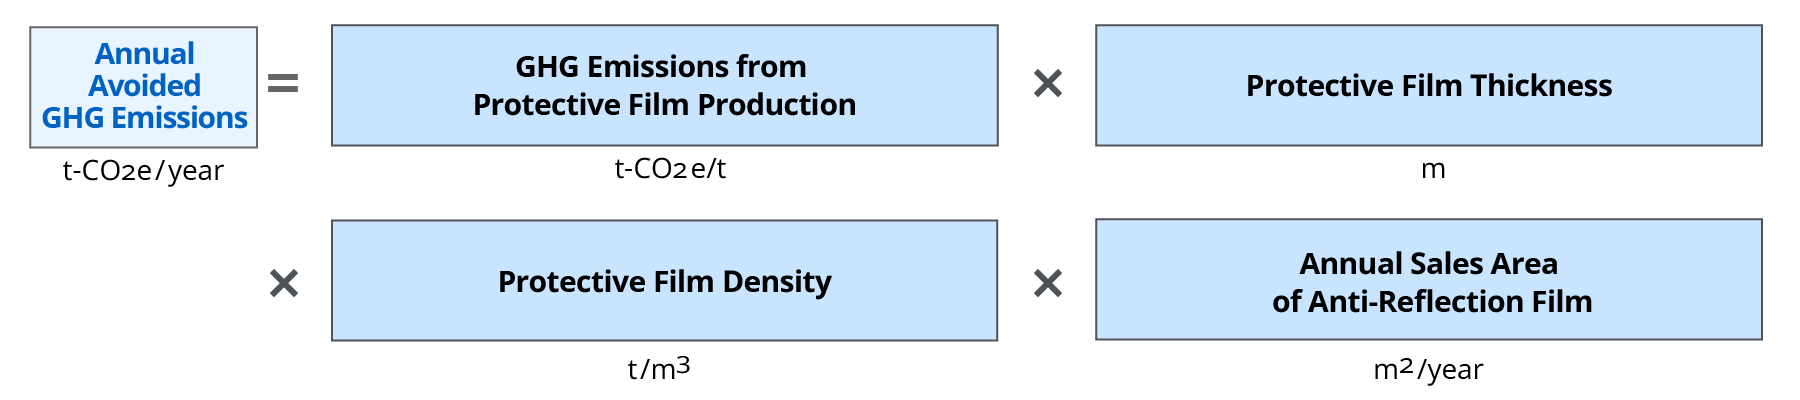
Assumptions
The calculation assumes that an area of protective film equivalent to the area of Konica Minolta anti-reflection film sold is eliminated and calculates the resulting reduction in GHG emissions from the raw materials and production of the protective film.
Timeframe
The calculation period is one year (FY2025).
Calculation Basis
- The area of protective film eliminated is calculated based on the area of anti-reflection film sold by Konica Minolta.
- PE is assumed to be the main raw material for the protective film. The thickness is based on Konica Minolta's research using actual market data.
Assessment Based on the WBCSD Guidance
- In this calculation, Konica Minolta has confirmed that the three Eligibility Gates are satisfied.
Gate 1: Konica Minolta's SBT net-zero target has been validated.
Gate 2: This effect contributes to the "Material Efficiency" mitigation measure identified in IPCC AR6.
Gate 3: Based on the diagram above, GHG emissions are reduced mainly by eliminating the need for protective film. - Avoided GHG emissions from anti-reflection film are not subject to third-party assurance.
Limitations
These calculation results are based on the above assumptions; actual GHG reduction effects will vary depending on operating conditions.